One very specific aspect of data visualisation is that it almost always mixes graphic elements with text. In many cases the graphics are published as bitmap images (JPG or PNG), and the text is “baked into the graphic”: the text characters are part of the image, and are not accessible.
All accessibility guides advice against presenting readable text as images. There are multiple arguments for this negative advice:
- screen readers and other assistive technology like page translators cannot read the text enclosed in images
- images might not load (due to low bandwitdth or other restrictions)
- the display of text (like font size, wrapping, colours) is controlled by the browser and by user settings. When text is contained in an image, this control is overruled.
- on top of that, text in images are not indexed and are excluded from search engine crawlers
A few practices can mitigate or overcome these issues:
- using an alt attribute for the image that repeats the text on the image. The alt attribute of an image in html is a description of the image that is displayed when the image is not available. But the alt attribute is also used by screenreaders to describe an image. It is a required html image attribute, and content management systems and other publication platforms provide input fields to add alt descriptions to images.
- using vector images instead of bitmap images. Vector files like SVG can include text elements, which in contrast to text in raster graphics is selectable and accessible to screenreaders and search index robots.
- when a graphic is too complex to use vector graphics or when no vector version can be produced (this is often the case for maps, which might have satellite imagery in the background, for example), techniques exist to overlay accessible html text on top of an image. ai2html is a tool specifically designed for this purposes: it converts Adobe Illustrator files to bitmap files with html text.
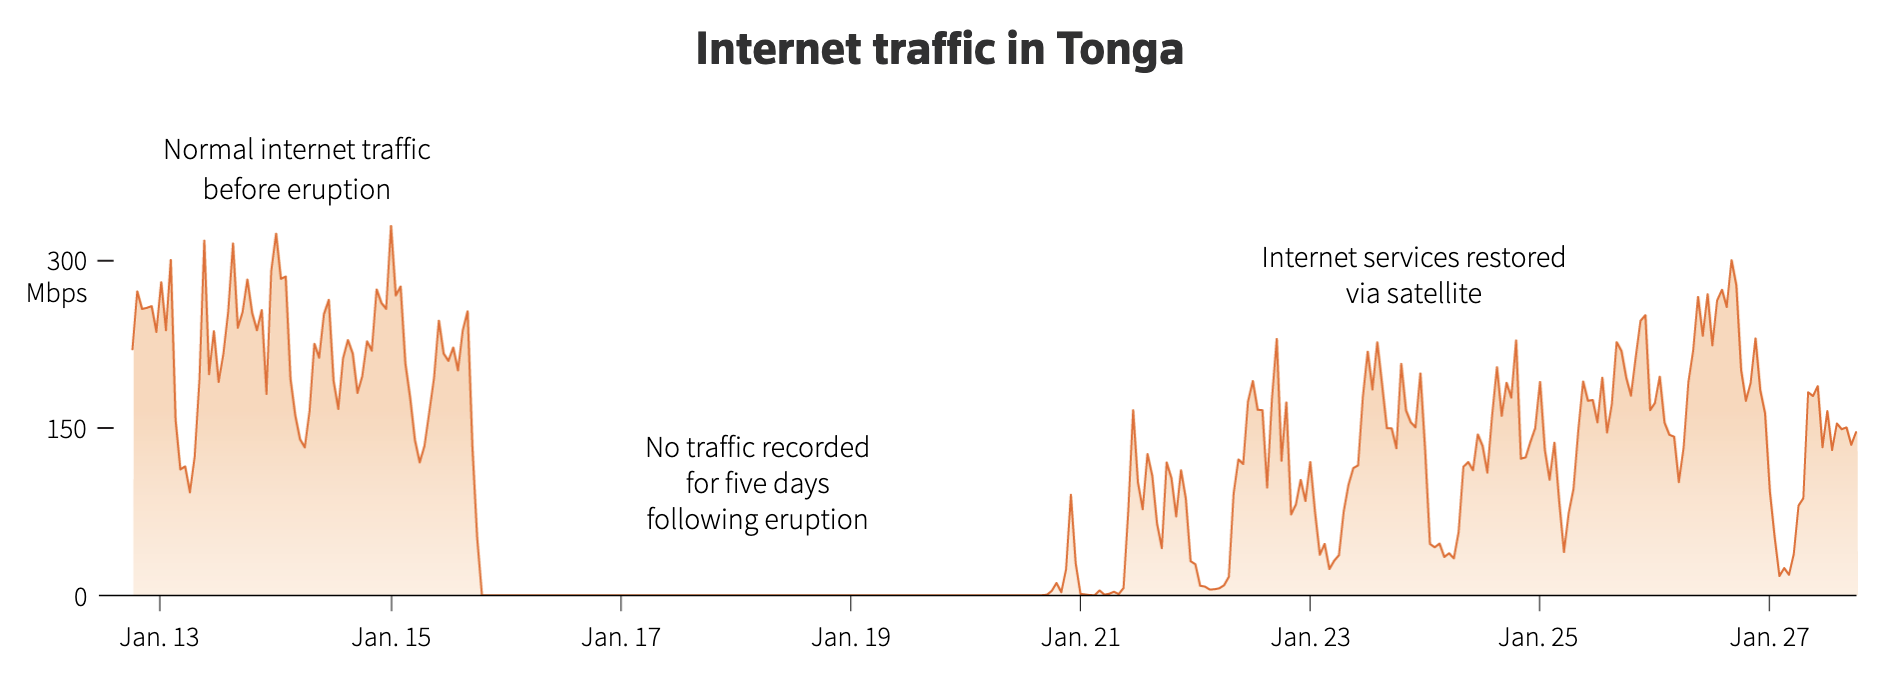
An annotated chart. Source: The race to reconnect Tonga, Reuters
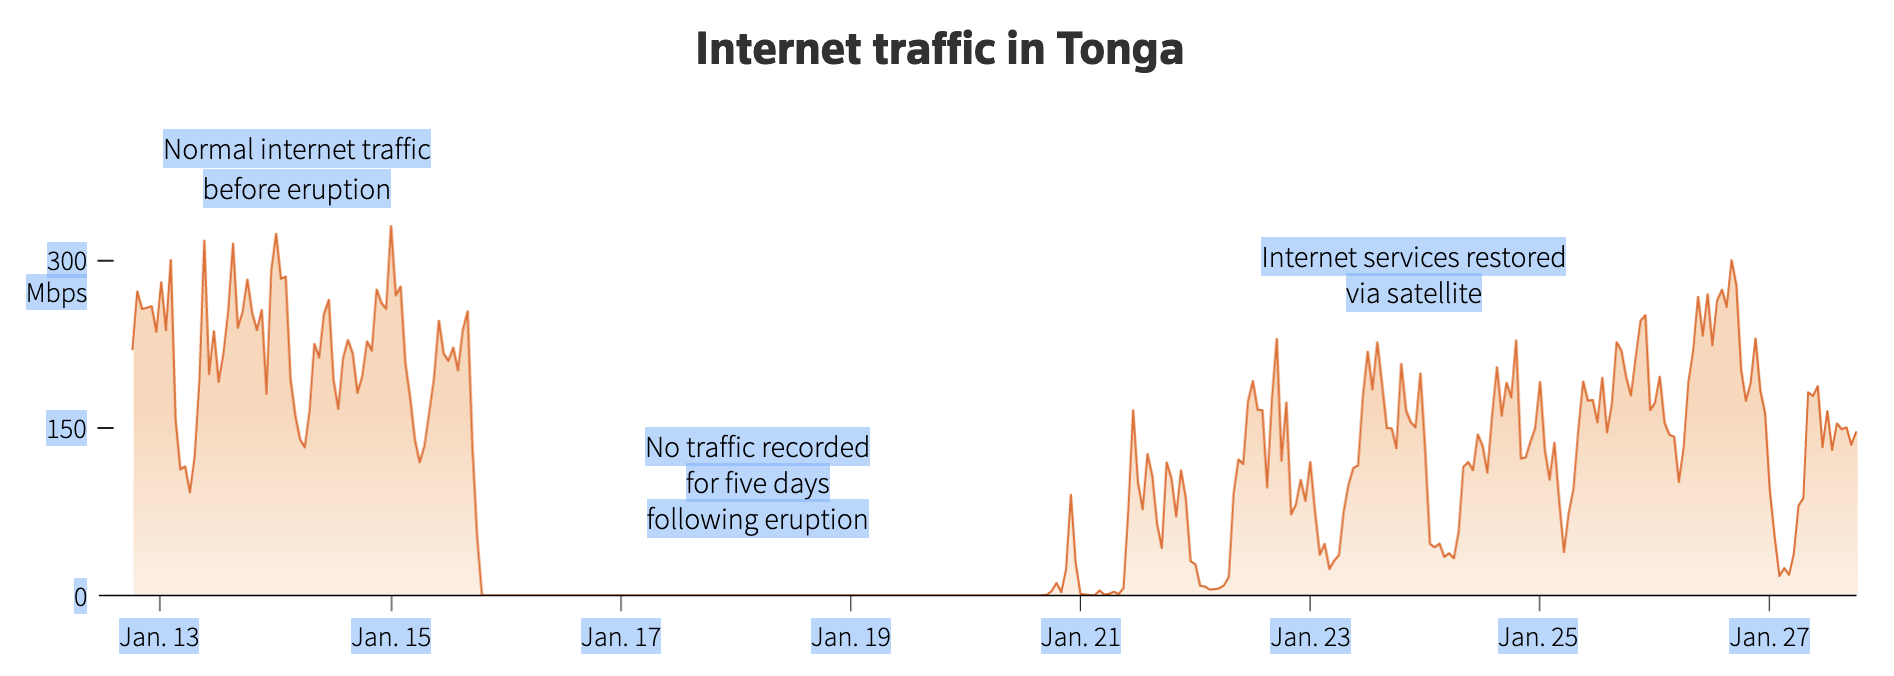
All text on the chart is selectable in the browser, which means it is also accessible to screenreaders. Source: The race to reconnect Tonga, Reuters
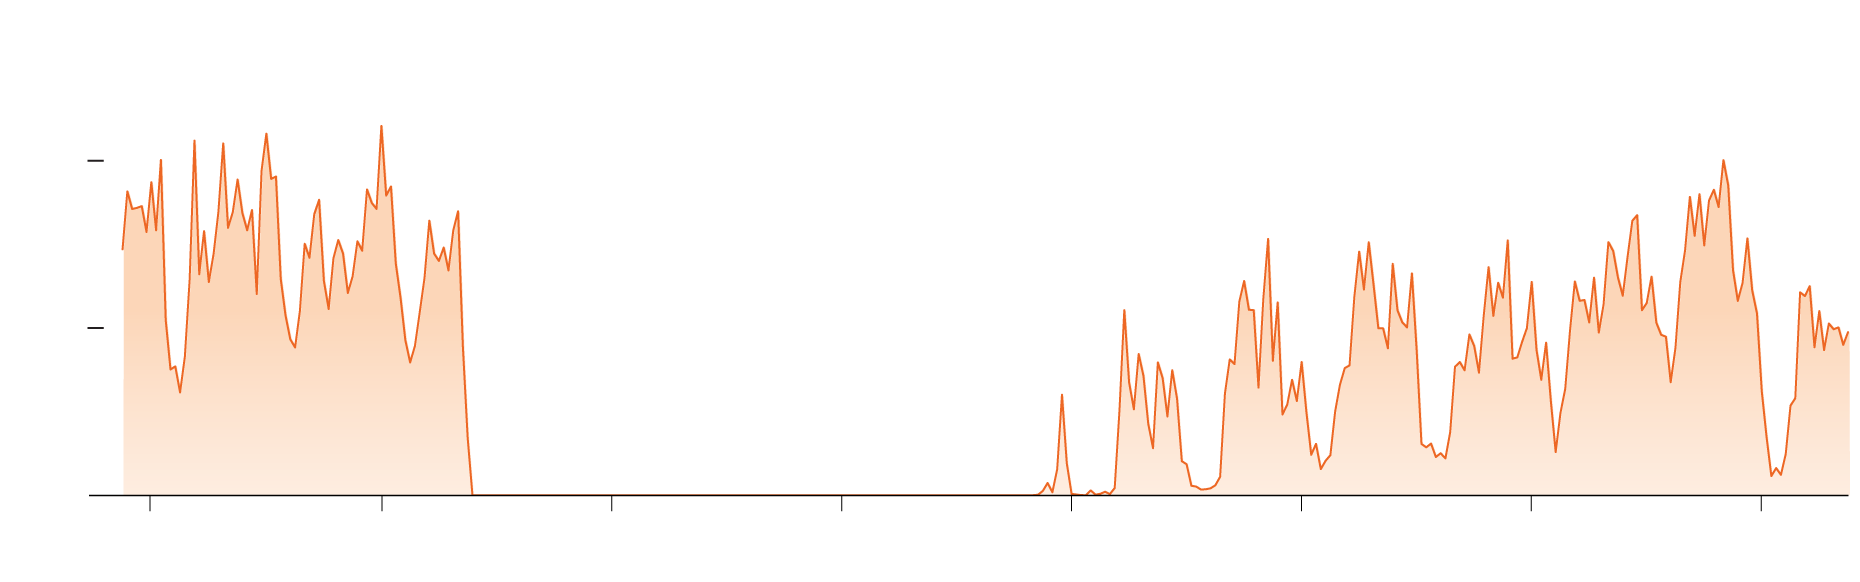
This the background image on which the text for the annotations is overlaid as html. Source: https://graphics.reuters.com/TONGA-VOLCANO/znpnejbjovl/cdn/images/graphics/internet-chart-lg.png