Decimal sign
In most but not all European countries, the comma is used as the decimal sign. So the decimal sign is localised, and formatting of numbers should be taken into account when translating visualisations, and when making visualisations for a wider audience.
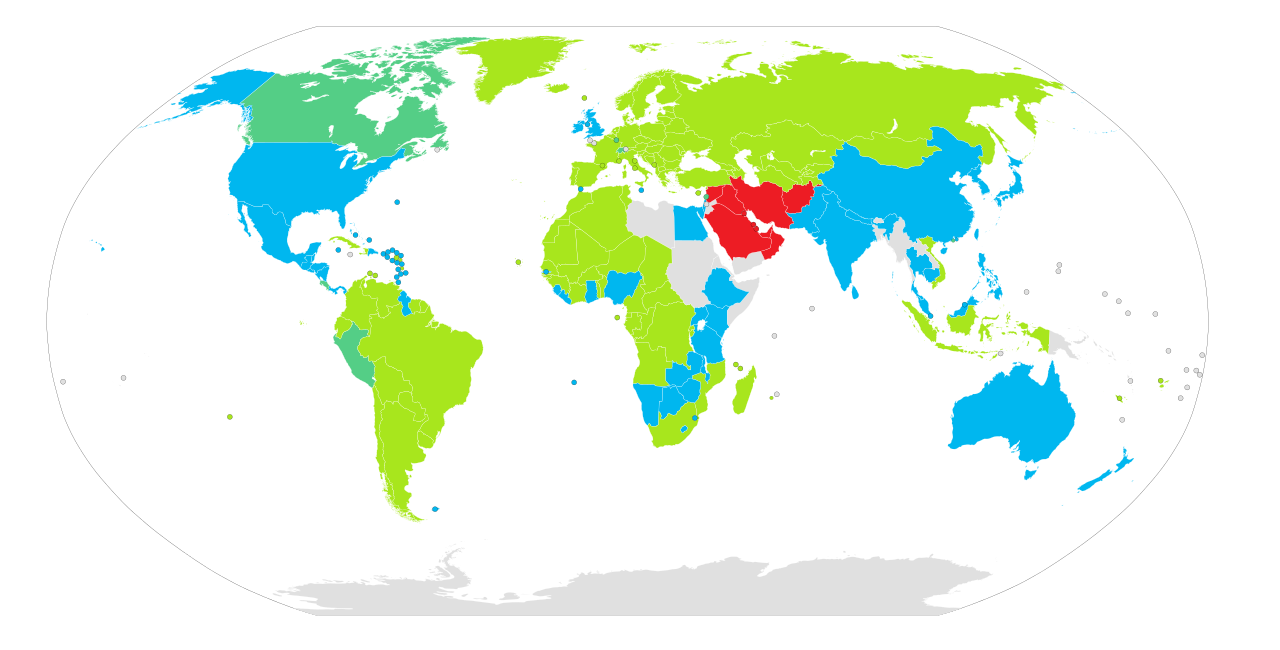
The use of decimal signs worldwide. Green = comma, blue = point, blue-green is both and red = Arabic decimal separator. Source: NuclearVacuum, CC BY-SA 3.0
Thousand separators
Compare the following formattings of the same number:
- 4000000000
- 4 000 000 000
When digits are not grouped, readers have to stop and count the zeroes, which is not an easy task. For large numbers, grouping the digits improves legibility. The way of grouping digits is also localised: depending on the language and local habits, different delimiters are used, like the comma, a dot, a space or an apostrophe.
In European languages, digits are grouped in groups of 3, and the delimiter is called the thousand separator. In English, the comma is used as the thousand separator, while in other languages the comma is the decimal sign and a dot or a space is used as thousands separator.
Other countries and cultures have different digit grouping habits. For example, in China and Japan, large numbers are read with groups of 10.000.
Words and symbols
But in many cases the use of many zeroes and thousand separators can be avoided altogether. One way of doing this is by using words, and writing 37 million instead of 37.000.000 and 2,5 billion instead of 2.500.000.000.
Another way of doing this is to use SI prefixes. These are abbreviations of the prefixes used in the metric system. Examples are “k” for thousands (derived from “kilo”), “M” for million (derived from “mega” and “μ” for 1 millionth (derived from “micro”).
These prefixes are handy in visualisations, where space for numbers and labels is scarce, and they are part of international standard. But not all of the prefixes are widely used and understood, and some of them might cause confusion. For example, in French, the words for thousand (”millier”) and million (”million”) both start with an m, which makes the M prefix for millions ambiguous. For the same reason, the “k” prefix is not used in French.
Recently, the Financial Times stopped using “m” for millions for another reason: this prefix can be misinterpreted by screen readers.
Picking formats
Visualisation tools can have built in number formatting, which means that they will pick a default formatting (and rounding) for the numbers displayed on a visualisation, based on the settings of your computer or browser, the amount displayed and role the number plays on a visualisation (axis label, number in a tooltip, …). Good tools will give you the option to choose a different formatting, or even customise the formatting yourself.
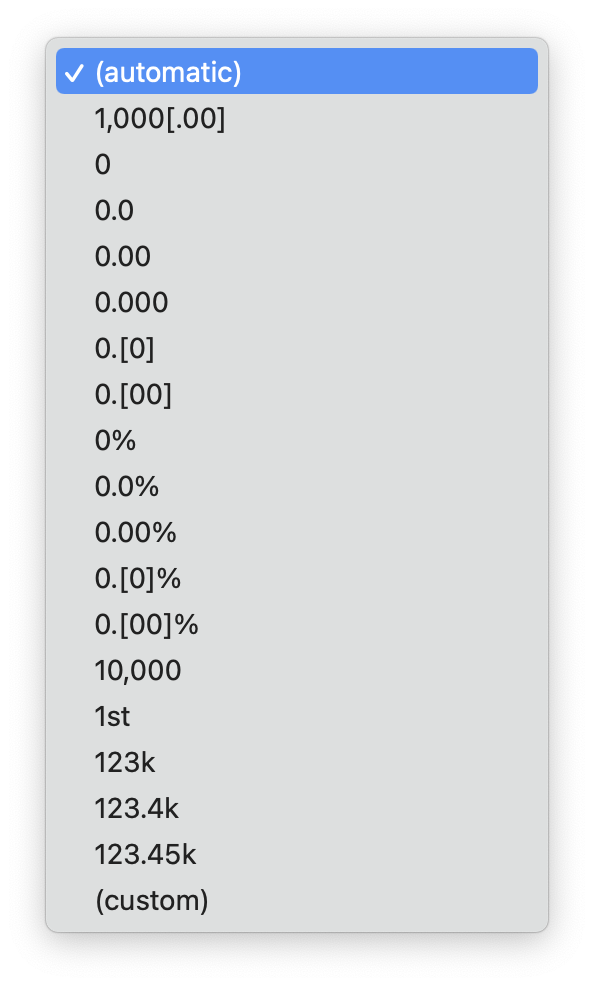
Number formatting options in Datawrapper
In some cases, custom formatting is desired. These include
- adding a “+” sign for positive numbers in case growth is shown on a visualisation. These can be in absolute numbers, or in percent. The minus sign for negative numbers will be present automatically for most formats.
- adding a symbol for currencies. Some visualisation tools allow you to add a prefix or suffix to numbers, you can use this option to specify the units of the numbers, including the currency symbol. Depending on the locale, the currency symbol is either prepended or appended to the numbers.
- scientific notation, like 1,3e+6 or 1,3E6 for 1,3 million. This notation is mostly used in the scientific and academic world, but its use should be limited to that context given that many people are not familiar with this notation.