Search results (3)
Skip results of view News and Highlights

Looking back at 2021 and looking ahead to 2022
As the year is coming to an end, the team behind data.europa.eu takes stock of the past year and looks ahead to the next. 2021 featured many highlights. In April, data.europa.eu was born out of the merge between the European Data Portal and the EU Open Data Portal. By joining forces, not only were we able to make more open data available, we also were able to show an even bigger audience the great societal and economic potential of open data. This became even more obvious during the EU Open Data Days , where over 2000 participants saw open data in action. Under the tagline of Shaping our

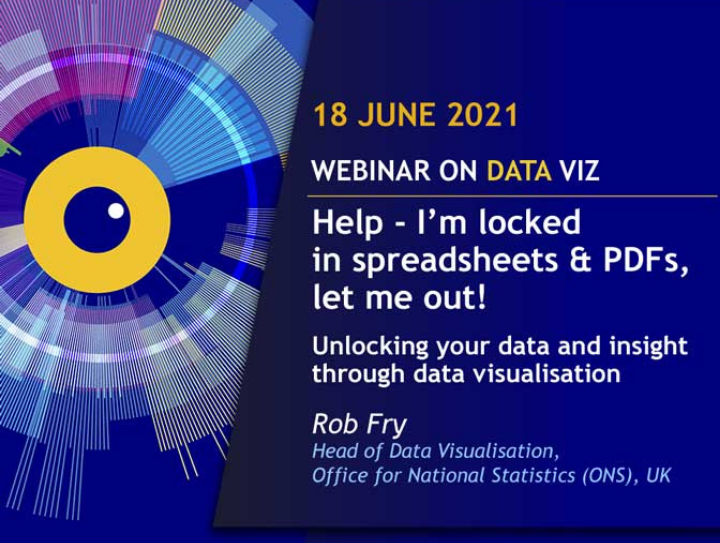
Help – I’m locked in spreadsheets & PDFs, let me out
On 18 June, Rob Fry – Head of data visualisation at the Office for National Statistics (ONS) in the UK – shared his insights on data visualisation in the EU DataViz webinar: “ Help – I’m locked in spreadsheets & PDFs, let me out”. In the webinar, he explains how the ONS has helped unlock data by making UK statistics more visual. Their multi-disciplinary team is made up of data visualisation specialists, data journalists, graphic designers, and social media specialists, working to create reliable and accurate national statistics on a variety of topics. The webinar covered the journey of the ONS

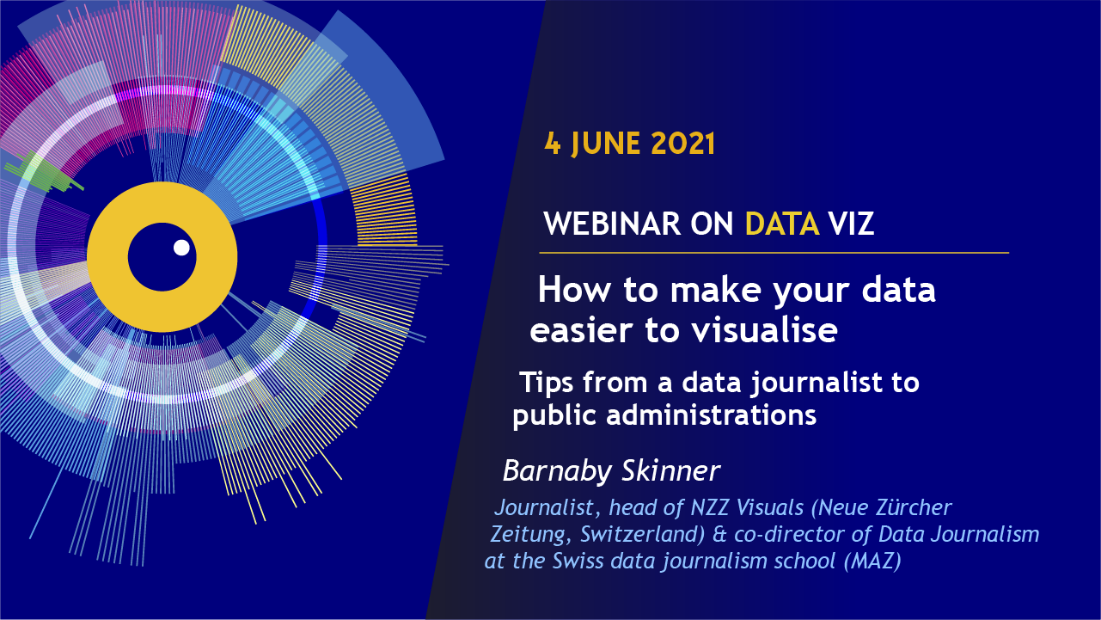
EU DataViz webinar: Is open public data easy to reuse?
On 4 April, Barnaby Skinner presented his insights on data visualisation in the EU DataViz webinar: “ How to make your data easier to visualise”. As the lead of the visuals department at the Swiss newspaper “Neue Zürcher Zeitung” he works closely with information designers, software developers and data journalists and has focused on digital transformation throughout his journalism career. Visualising and presenting data in a way that it is easy to digest while still informative, is becoming an ever-more critical asset as the amount of data grows increasingly. Sharing structured and machine
