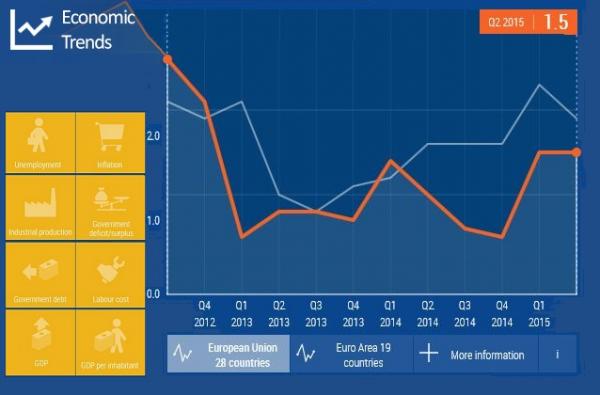
The interactive data visualisation tool "Economic trends" provides every user, from basic to professional, a quick and easy overview of the development of 8 main economic indicators.
After selecting an indicator & a country (or the EU / EA aggregate), the trend of the indicator over the last 12 time periods will be displayed in a graph. Additionally, you can add the EU or EA aggregate for comparison.
For some indicators, you have the possibility to swap between units. For example, for inflation you can choose between the "change compared to the same month of the previous year" and the "change compared to the previous month".
Below the graph, you also have the possibility to obtain a definition of the indicator (see "i" button) and to access the source dataset (when clicking on "+ More information").
The app is available in three languages: English, French and German.