An Bhulgáir
Image

Blaganna: An Bhulgáir
Skip results of view Country Insight Blogs
Níl aon alt Blag ann faoi láthair
Use cases in: An Bhulgáir
Skip results of view Use cases
iSofMap is a website that visualises cadastral and spatial information and provides access to real estate data of the municipality of Sofia. The website also offers the possibility to contact various real estate services directly to make inquiries.
iSofMap is a website that visualises cadastral and spatial information and provides access to real estate data of the municipality of Sofia. The website also offers the possibility to contact various real estate services directly to make inquiries.
iSofMap is a website that visualises cadastral and spatial information and provides access to real estate data of the municipality of Sofia. The website also offers the possibility to contact various real estate services directly to make inquiries.
Tuarascálacha: An Bhulgáir
Skip results of view Doiciméadú
Study
Improving data publishing by open data portal managers and owners
Study
Open data best practices in Europe: Estonia, Slovenia and Ukraine
Study
Data sharing as a service: will data services remove intellectual property rights from the picture, and at what cost?
Study
ePSI platform scoreboard
Study
ePSI Platform PSI Scoreboard
Imeachtaí Sonraí Oscailte: An Bhulgáir
Níl aon imeacht ar na bacáin faoi láthair
Open Data News in: An Bhulgáir
Skip results of view An Scéala is Déanaí faoi Shonraí Oscailte


On Friday 16 February 2024, from 10.00 to 11.30 CET, the data.europa academy hosted the webinar ‘Open data maturity 2023: best practices across Europe‘ which highlighted Slovakia's and Serbia's accomplishments in the field of open data. With nearly 600 registrants, the event underscored the growing interest and commitment to open data across the continent. An expert from data.europa.eu initiated the session by presenting the ODM results , setting the stage for in-depth country analyses. Following this introduction, the narrative shifted to Serbia . In just two years, Serbia demonstrated
On 1 March 2024 , from 10:00 to 11:00 CET , our webinar on "New b usiness m odels for d ata- d riven s ervices" is set to provide fresh insights into the utilisation of open data. Th e event, building on the data.europa.eu discussion paper , aims to explore how public sector information, when made available as open data, can be purposefully re-used to creat e value for both public and private sectors . In recent years, the focus on open data has shifted towards understanding and meeting end-user needs. Th e webinar will examine the potential of open data in Europe, exploring how it can drive
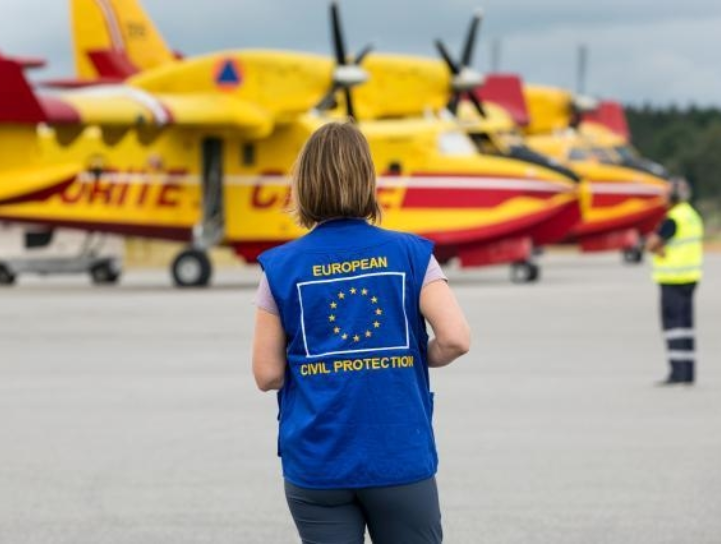
This year marks the fifth anniversary of RescEU, an initiative by the European Commission that has strengthened disaster response mechanisms across Europe. Established to extend the EU Civil Protection Mechanism, RescEU embodies a deep commitment to protecting citizens from diverse disasters and managing emerging risks effectively. Since its launch in 2019, RescEU has served as a robust reserve of European capacities, fully funded by the EU. This includes a fleet of firefighting aircraft, medical evacuation planes, and critical medical supplies and field hospitals, ready to tackle health
The International Day of Women and Girls in Science, celebrated on 11 February, highlights the critical role women and girls play in science and technology. This year, the focus is on "Women in Science Leadership: A New Era for Sustainability," recognising their contribution to tackling global challenges such as health and climate change. The diversity in research, brought by women, brings fresh perspectives, talent, and creativity, essential for sustainable development. Despite progress in higher education, women continue to be underrepresented in Science, Technology, Engineering, and