A major advantage of vector images over bitmap images is that vector graphics can be zoomed in without any loss of quality: because all the visual elements are described in coordinates, software rendering vector graphics can always produce crisp images, independent of the zoom level.
When you zoom in on raster images, at some point the individual pixels will become visible, and the picture will become pixelated.
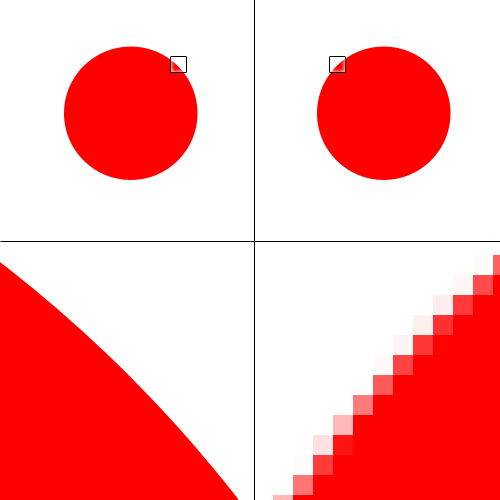
What vector (left) and raster (right) graphics look like when zoomed in. Source: Rex, public domain
SVG is part of the html specification, so they are native to the web. As such, they can be styled with CSS (Cascading Style Sheets: files that describe how HTML elements are displayed on the screen) and manipulated with JavaScript, which makes them a good fit for interactive data visualisation. Check for example the blue circle in the output on the right of this JSBin: it is an SVG circle, which, through JavaScript, reacts to a click by changing its colour.