All bitmap images are made out of pixels. But pixels on themselves have no physical size: a pixel is just a reference to a row and a column, with the associated colour of the cell in the raster. Pixels only get a size when they are displayed on screen or on paper.
For digital displays, the factors at play are the resolution, size and pixel density. The resolution of a display is the number of rows and columns of pixels a screen can display. For example, a 1080p display has a resolution of 1.920 x 1.080 pixels, while a 4K display doubles that in each direction (3.840 x 2.160 pixels).
The size of a display is its size in physical dimensions, usually expressed in the number of inches of the diagonal. Given the length of the diagonal, width and height of a display can be derived from its aspect ratio. For example, a 16:9 27 inch monitor has a width of 60 centimeter and a height of 34 centimeter.
The pixel density of a display follows from its resolution and its size, and is expressed in pixels per inch (ppi) or pixels per centimeter (ppcm). A 4K 27 inch monitor has 3.840 pixels horizontally, distributed over 60 centimeter, so its pixel density is 3.840/60 = 64 pixels per centimeter.
Dots per inch (dpi), or alternatively dots per centimeter (dpcm) refers to the number of ink dots a printer can place on a line 1 inch or 1 centimeter wide. Higher dpi prints are clearer and contain more detail.
So, referring to the dpi of a raster graphic to describe its image quality or resolution, is not meaningful. A high quality raster images should have enough pixels so that when printed in the desired dpi, image quality is assured.
Take into account that printers need much more dpi compared to what displays need in pixel density (pixels per inch) because printers only have a limited set of ink colours to mix (see the page about CMYK). For each pixel on a digital display, printers need to mix dots of different colours in much finer detail to obtain the same colours, as is shown in the image below:
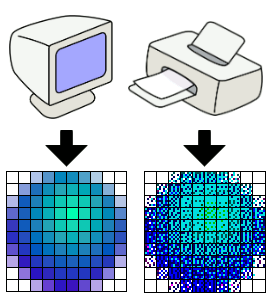
Source: Wapcaplet, CC BY-SA 3.0