Numbers can be converted into colours to communicate numeric data. But before dealing with the how and talk about methods to do that, here is the place to talk about the why.
The reason for this is that decoding numeric values from colours is not efficient. Take for example the following 2 colours:

Source: Maarten Lambrechts, CC-BY-SA 4.0
Now try to answer the following questions
- which colour represents the highest value?
- if the colour on the left represents a value of 1, what is the value of the second colour?
There is no way to accurately answer these questions, because there is no colour scale to map colours to values.
But there is more: even if there is a colour scale, it is still difficult to extract the exact value of the colours.
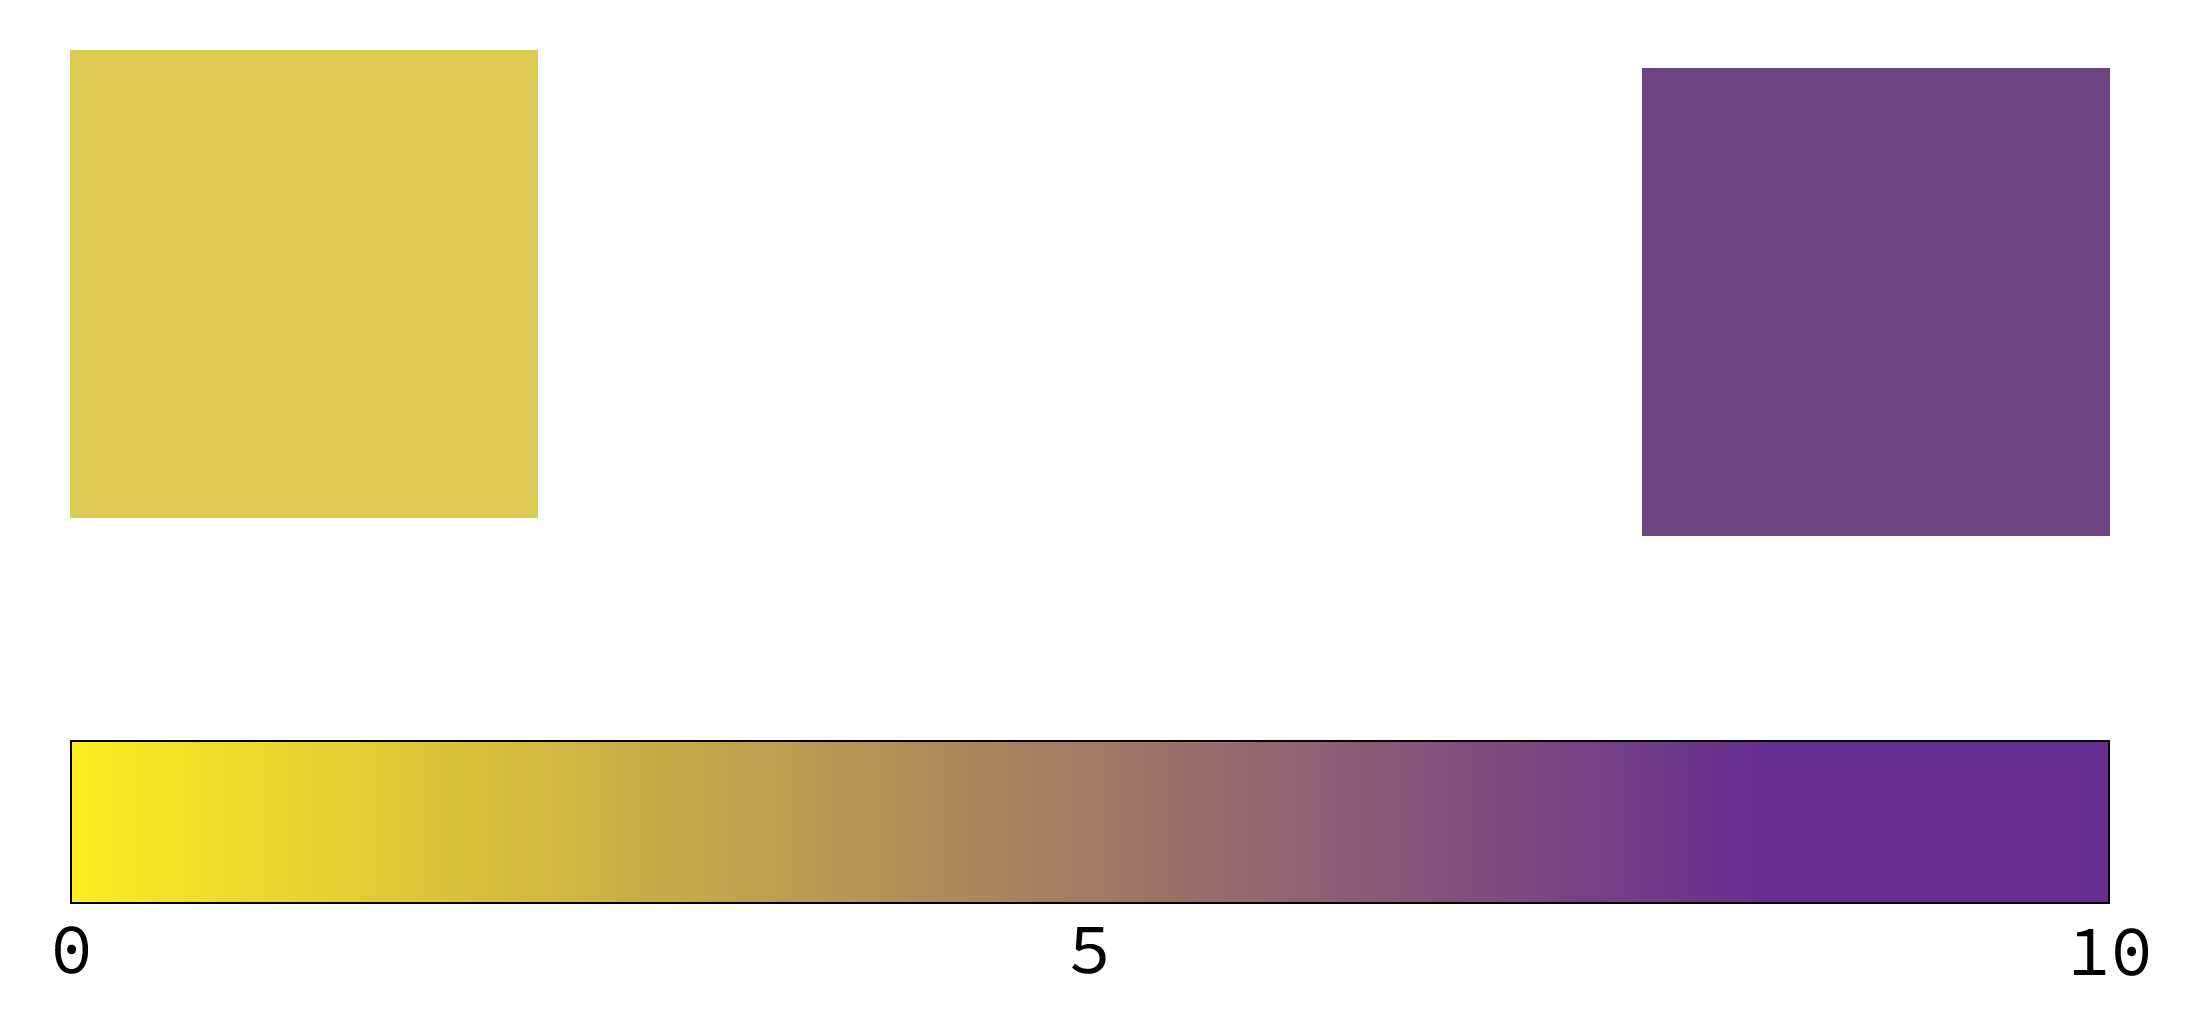
Source: Maarten Lambrechts, CC BY 4.0
If the numbers would be encoded in the length of bars, or in the surface area of squares, estimating proportions and the value of the second colour would be much easier. So, when reading any of the following, keep in mind that there are better, more effective ways of encoding numbers than turning them into colours:
- Colour for numerical data: #EndRainbow
- Colour for numerical data: perceptual uniformity
- Colour for numerical data: colour scales