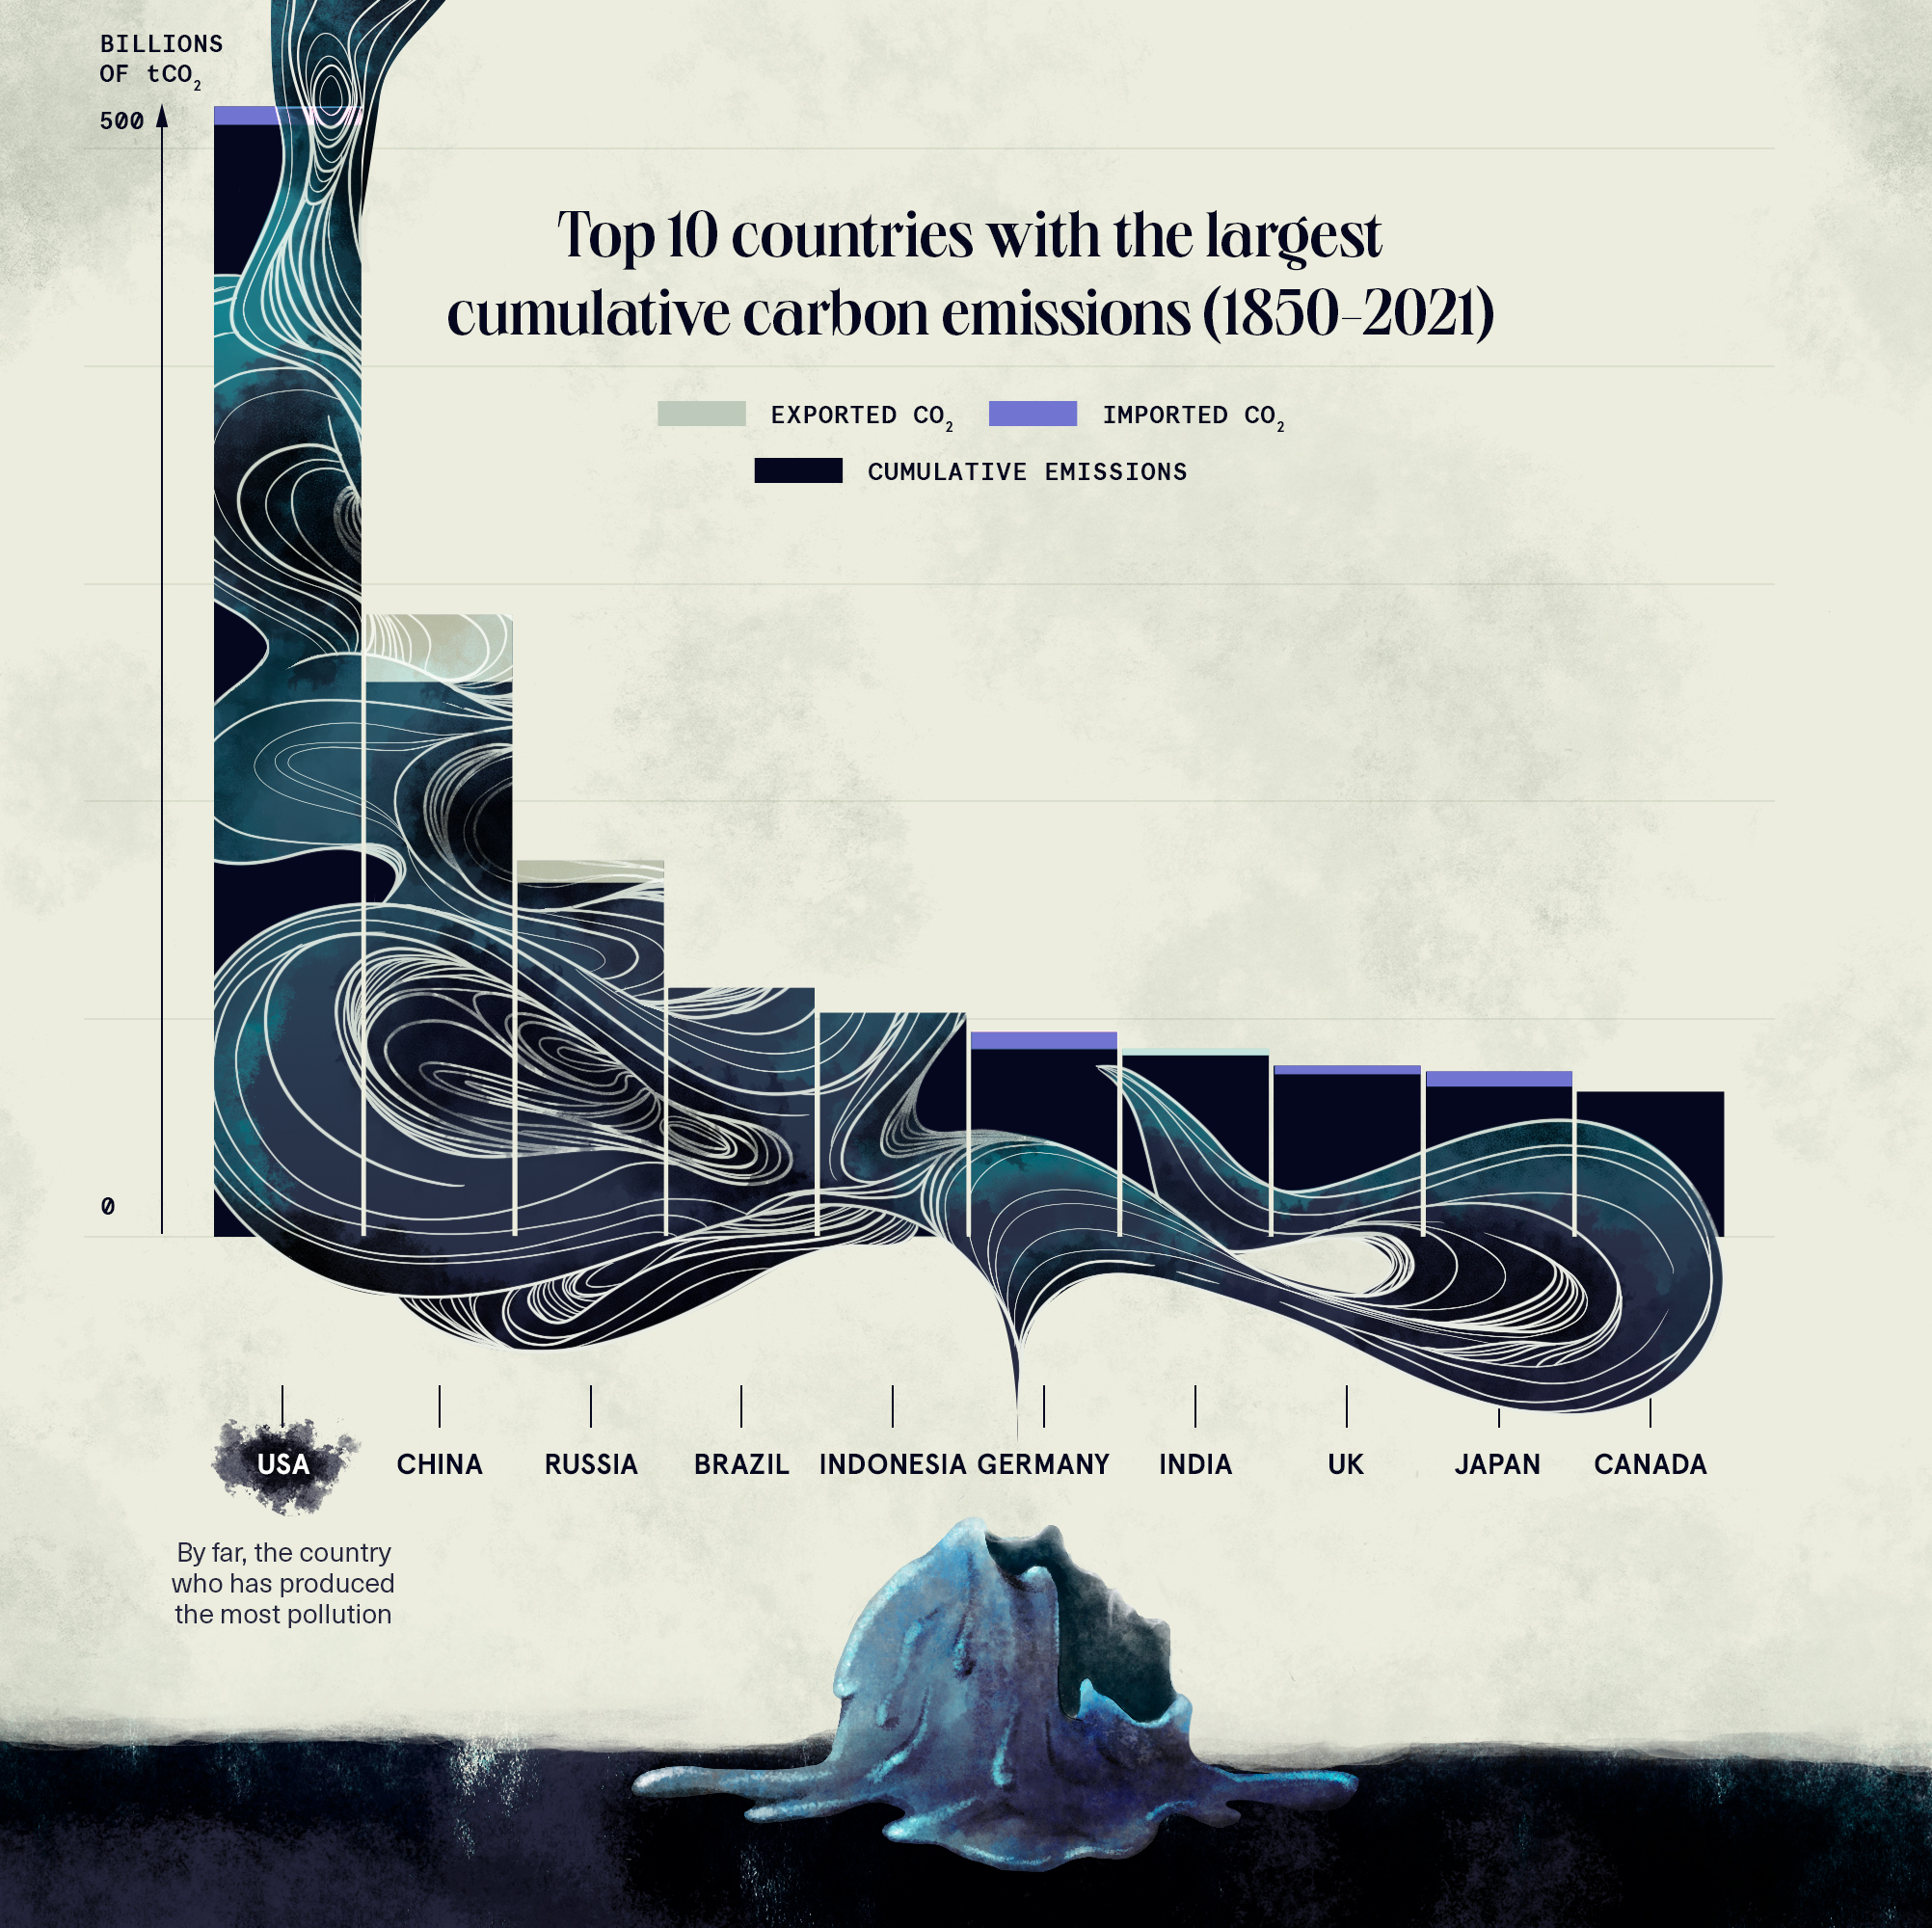
Some data visualisation designers have developed a very recognisable style by making hand drawn visualisations. One of these is Mona Chalabi.
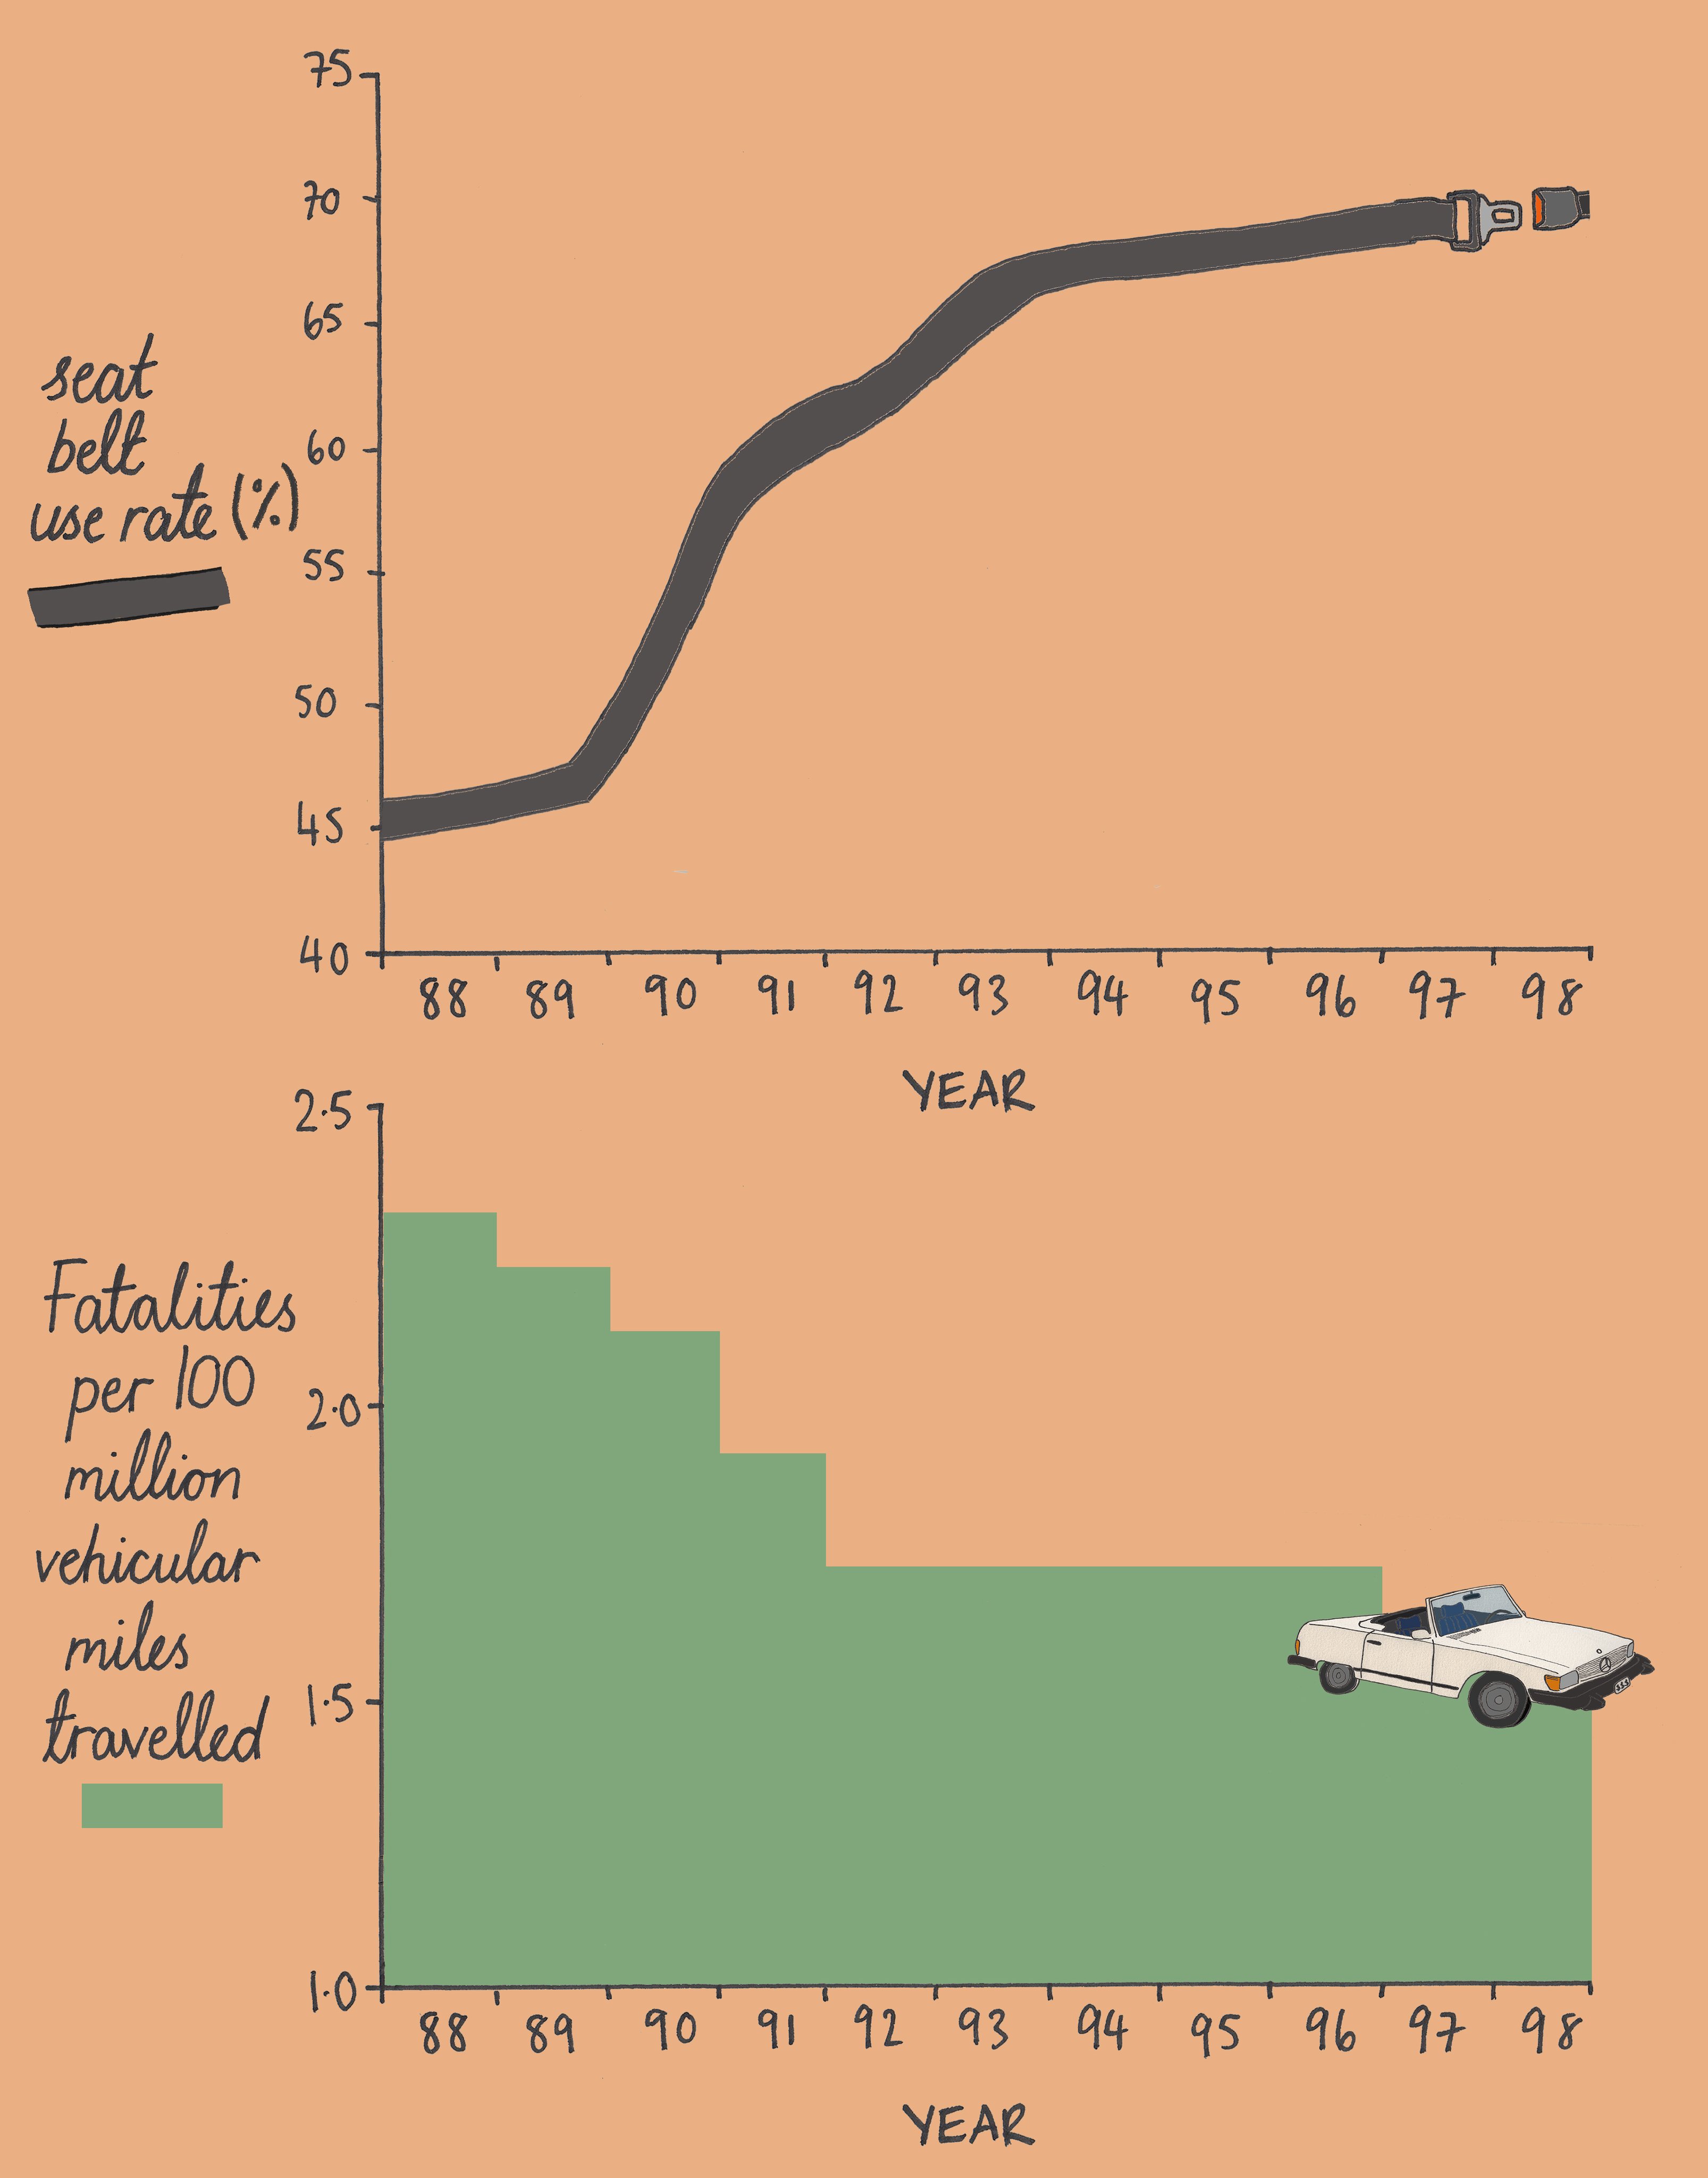
Source: @MonaChalabi
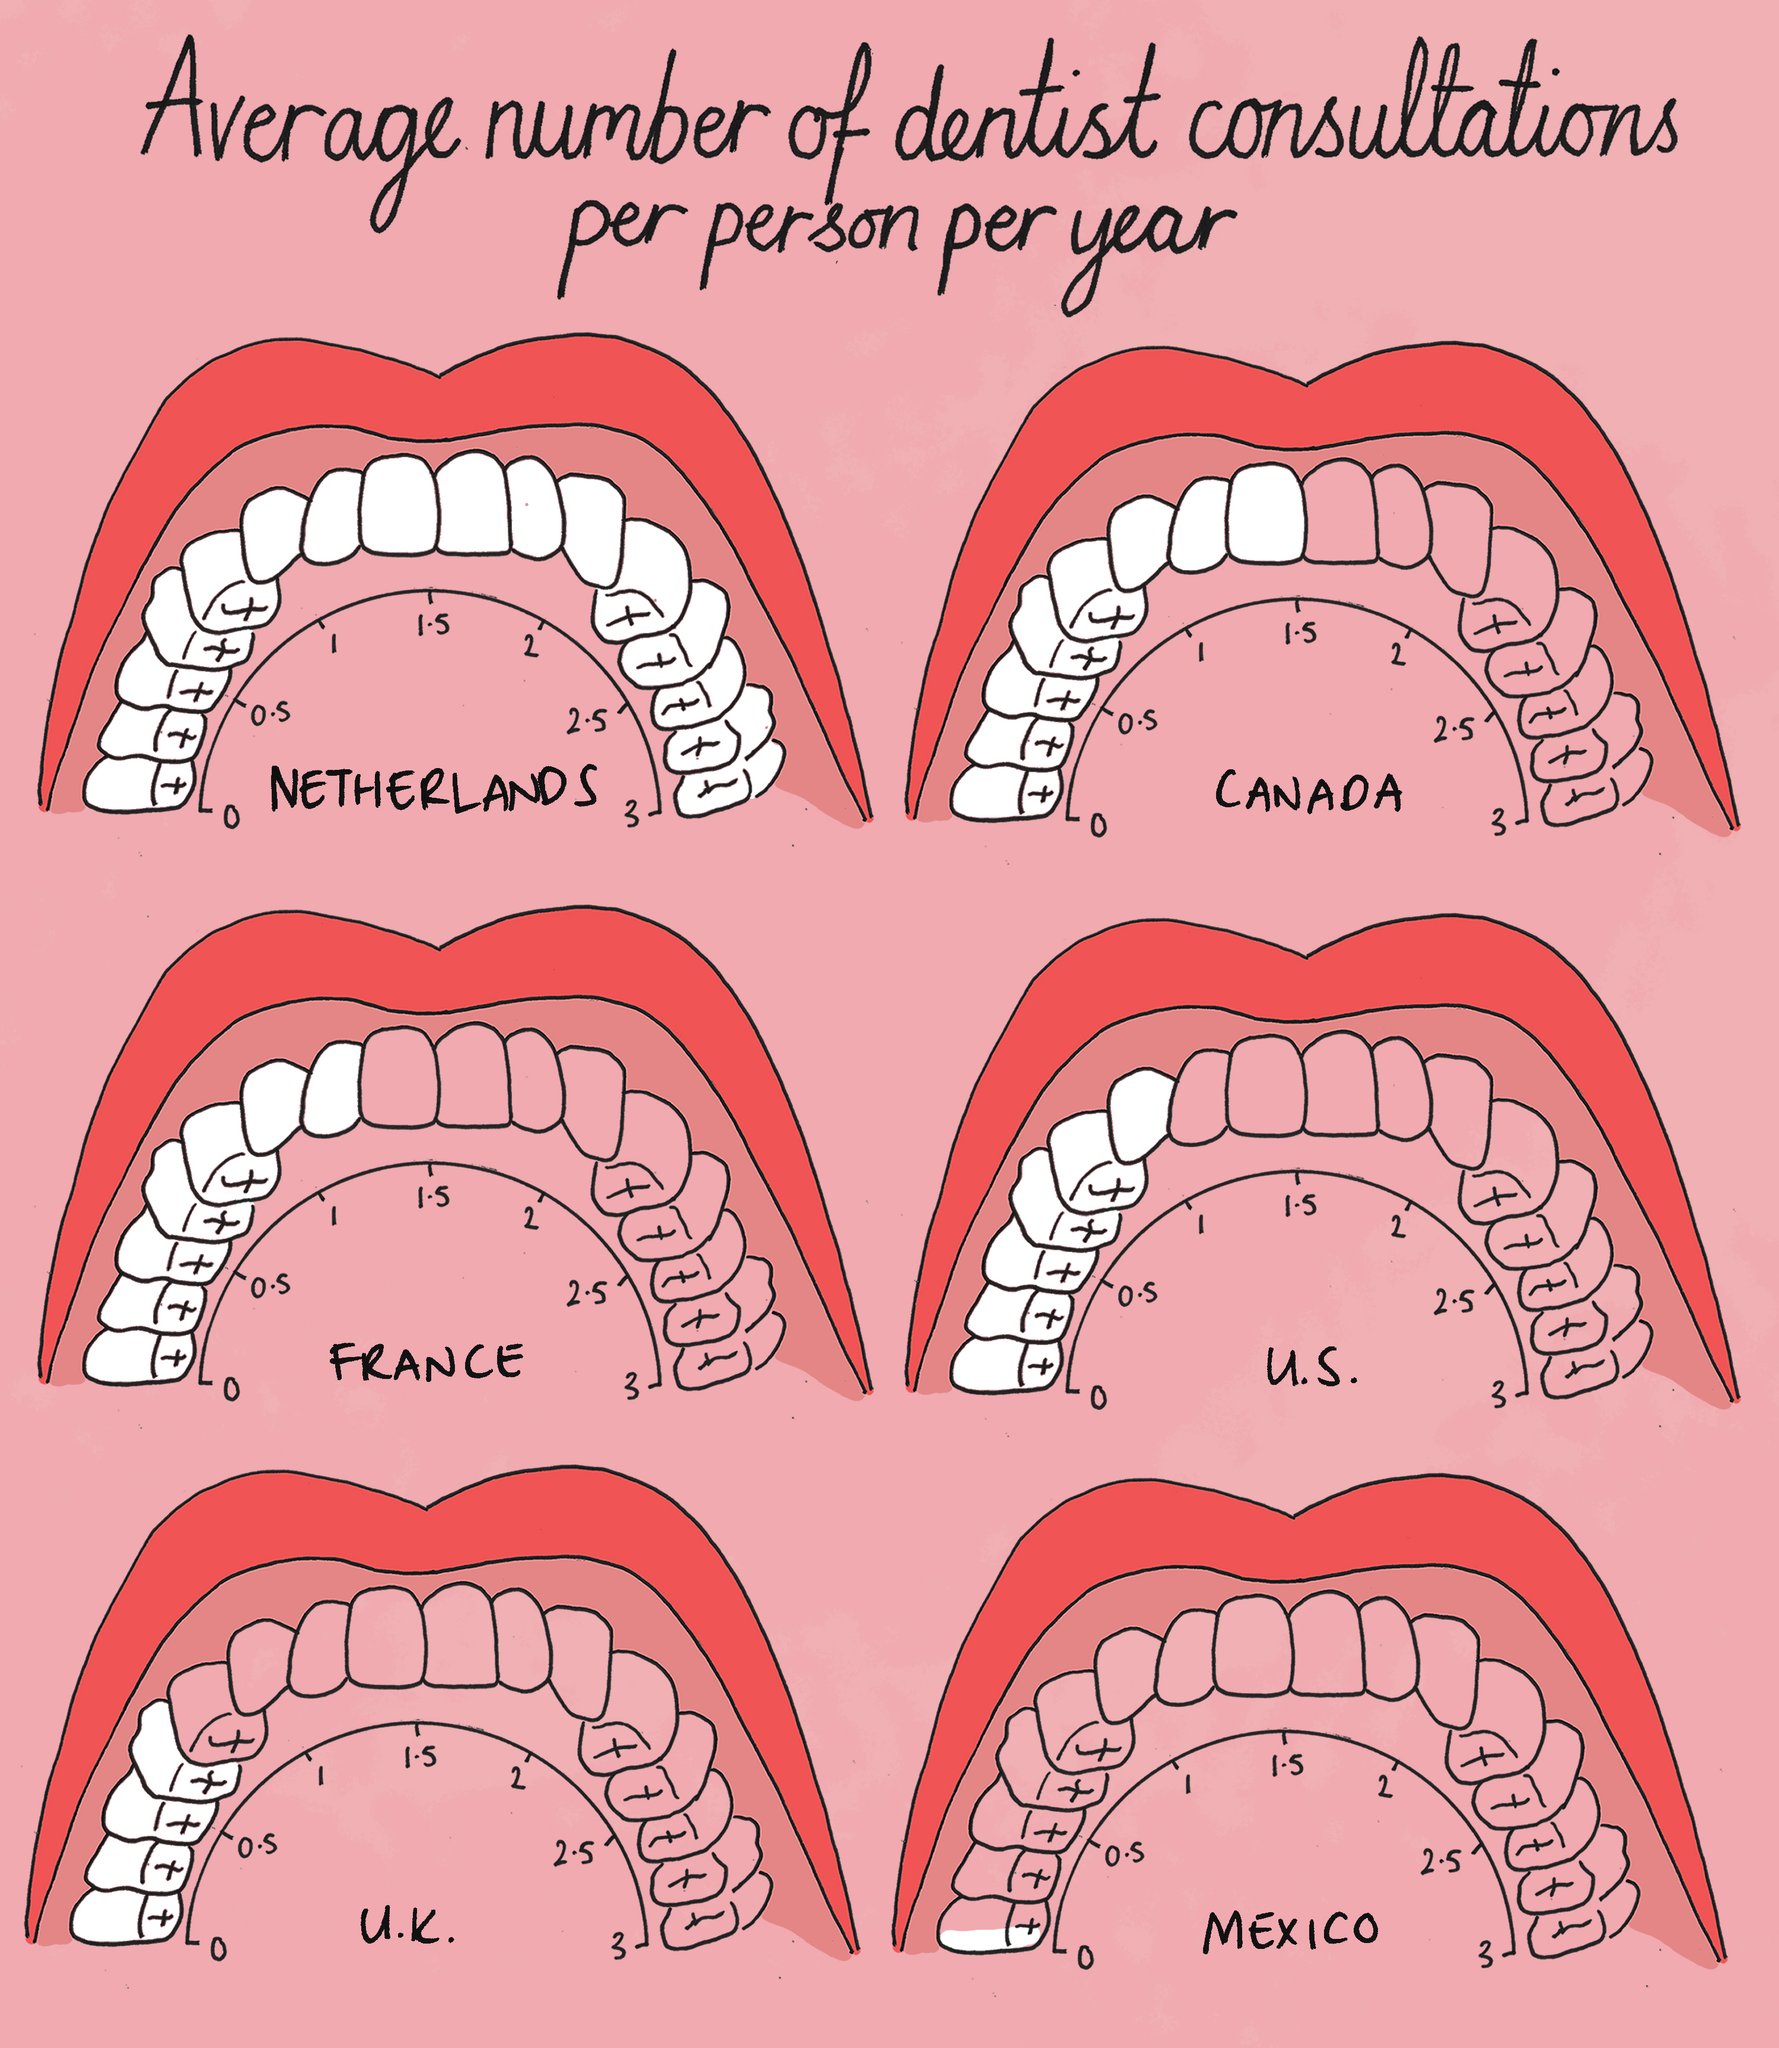
Source: @MonaChalabi
Data illustrator Gabrielle Merite is adding to the same genre, with collage-like data visualisations.
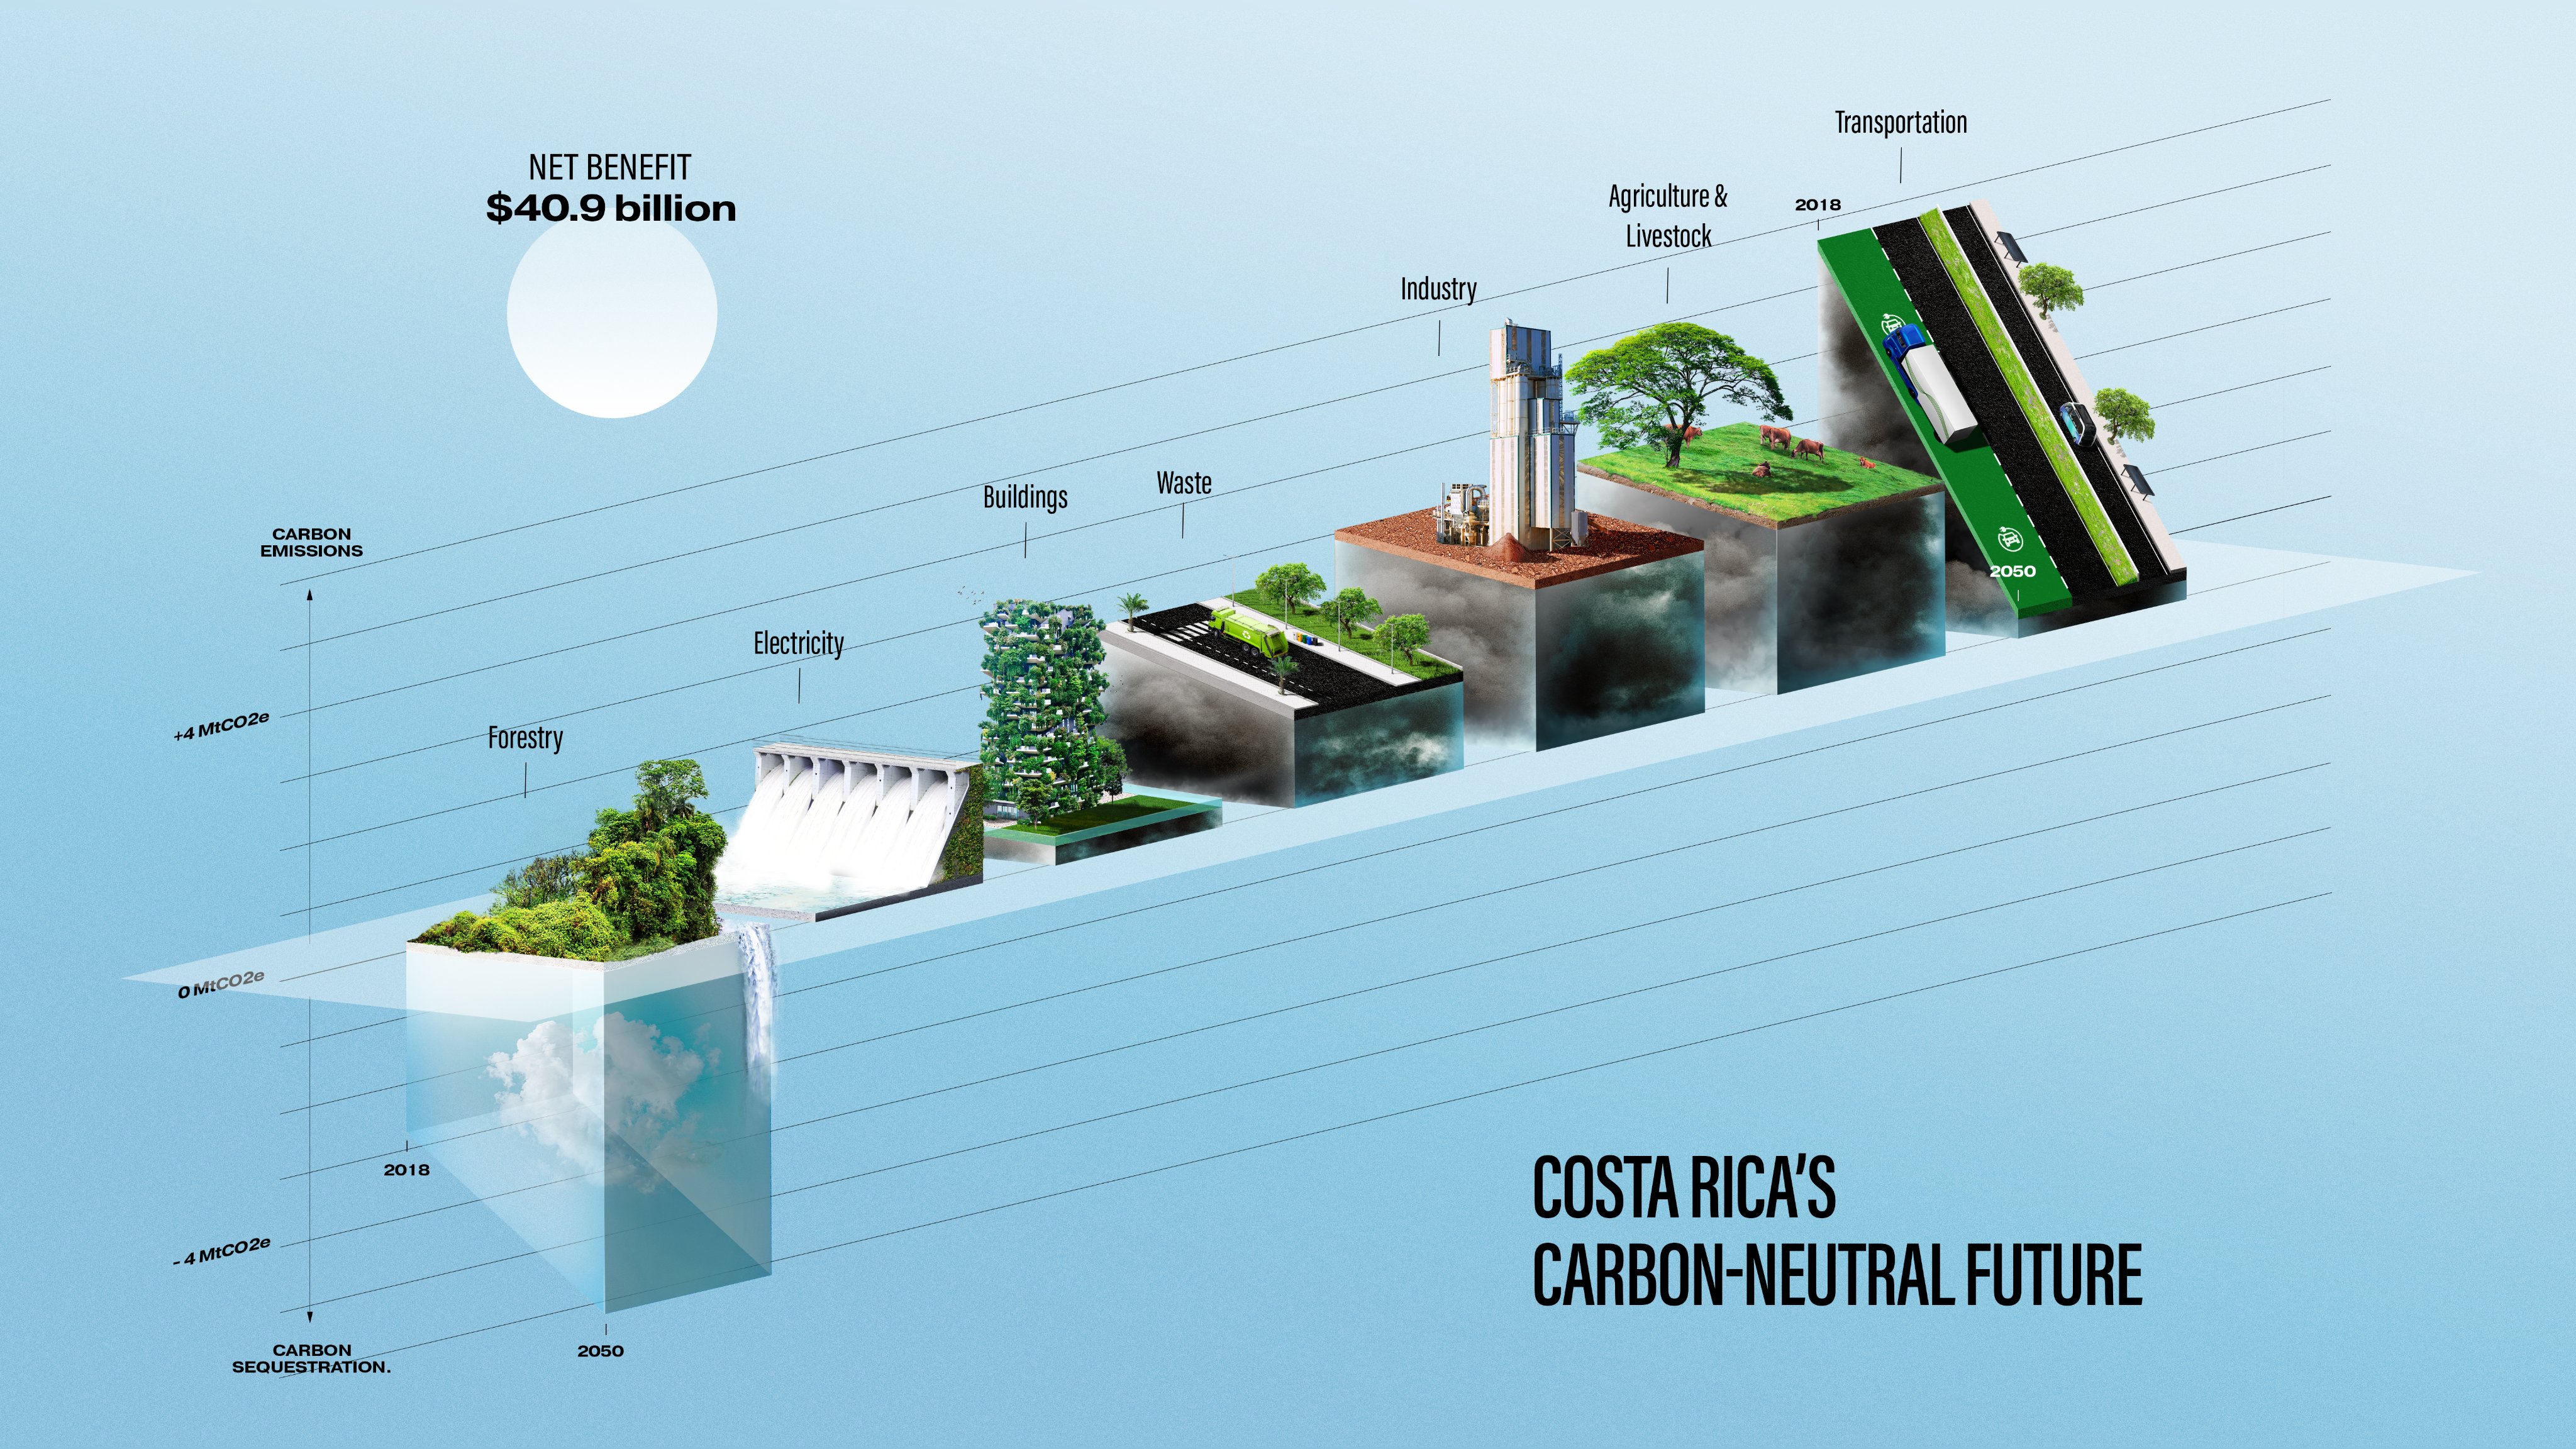
Source: @Data_Soul
Source: @Data_Soul
Source: @Data_Soul
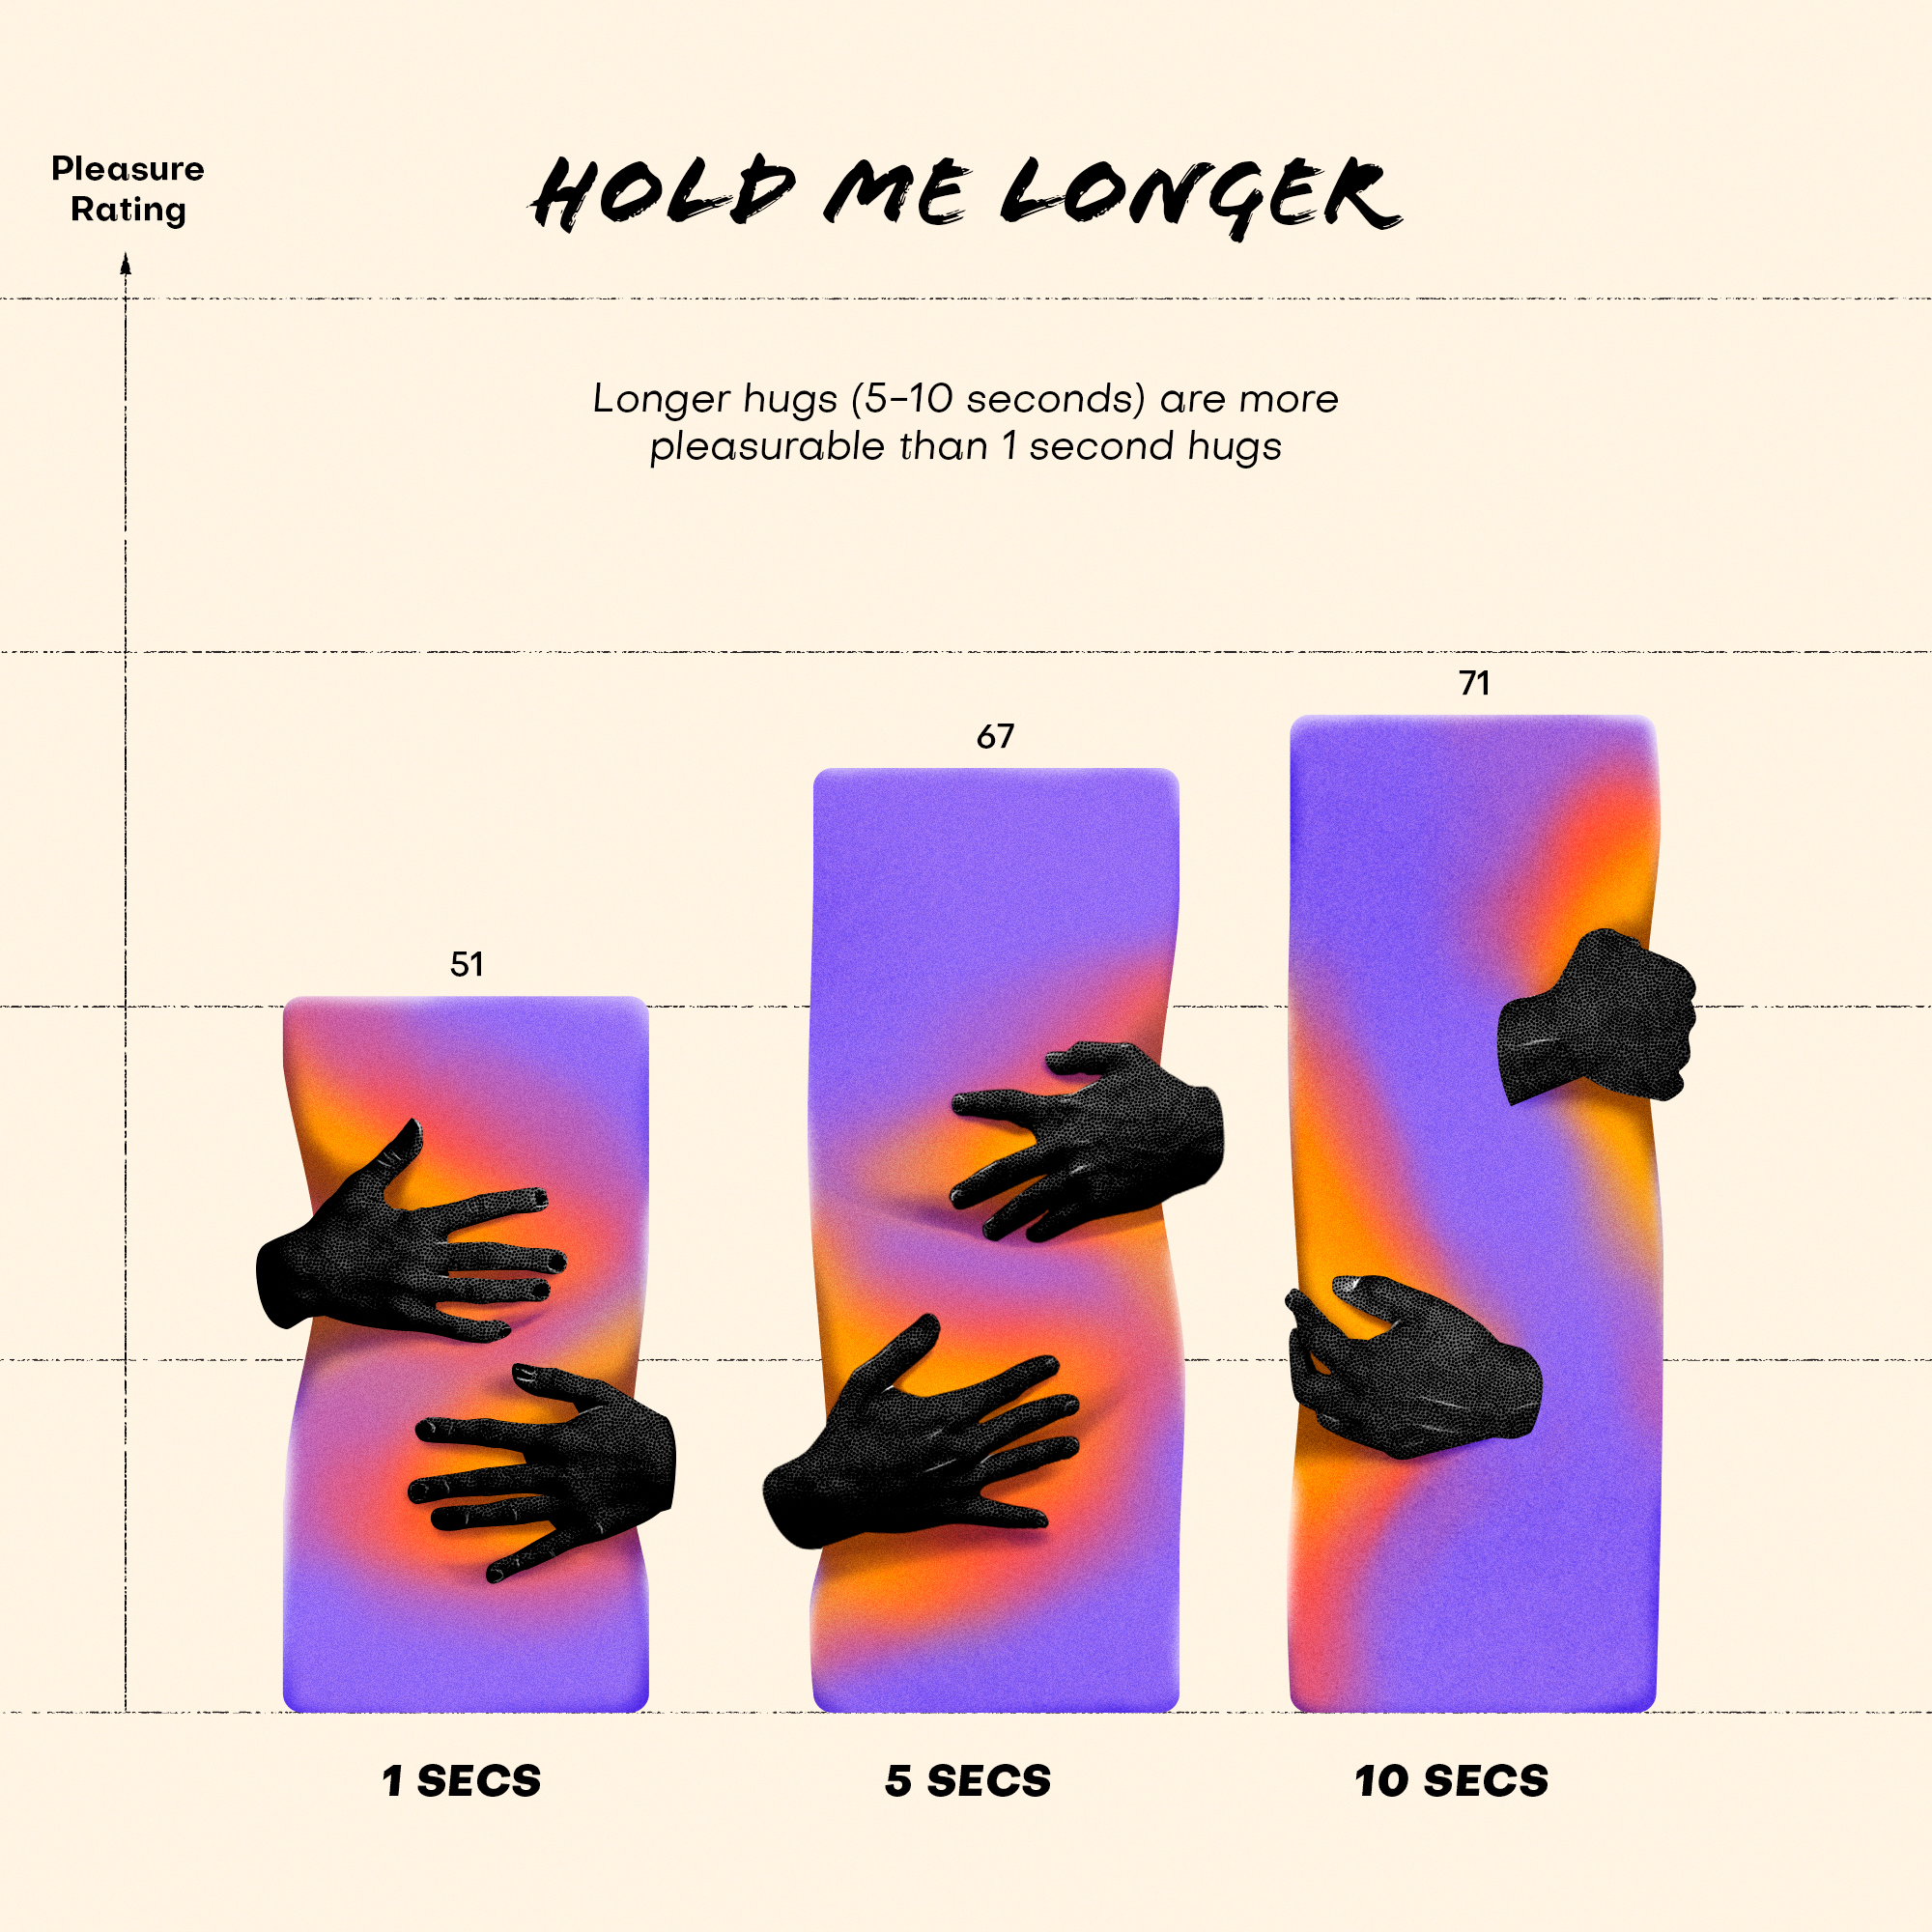
In a talk at the Outlier 2022 Conference, Robert Kosara (the researcher who coined the term “harmless junk”), highlighted this chart:
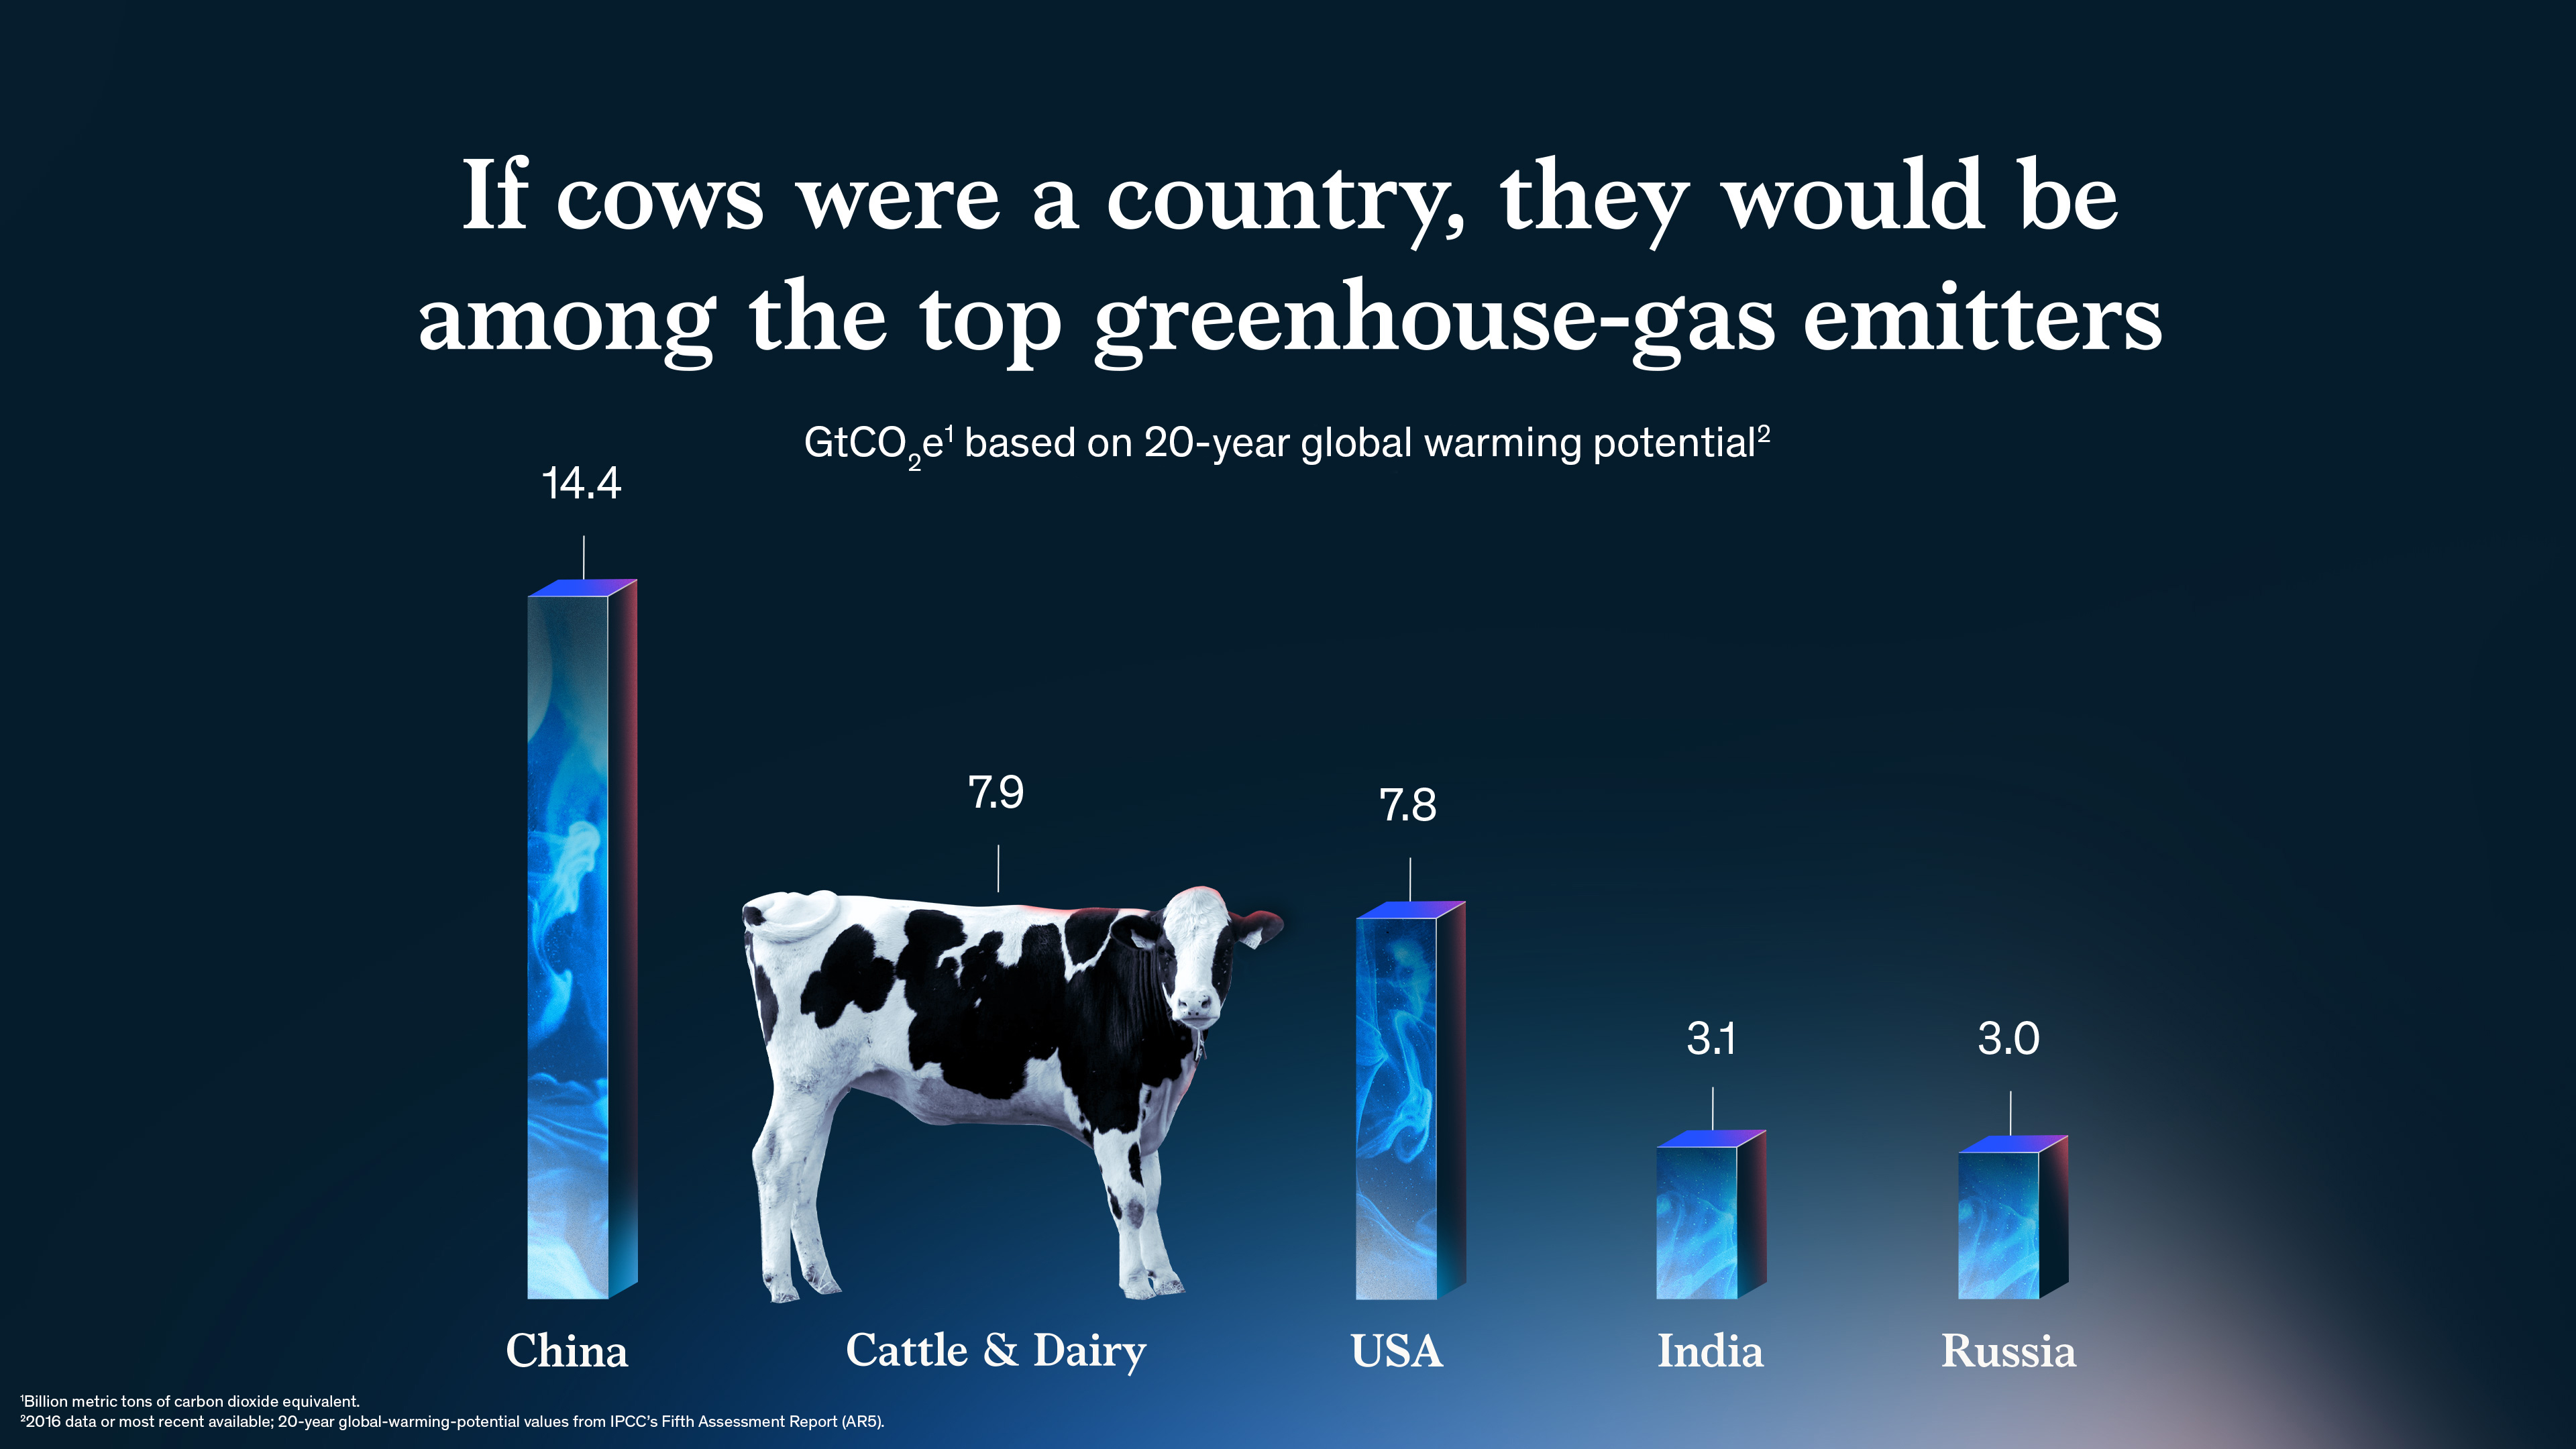
Source: @McKinsey