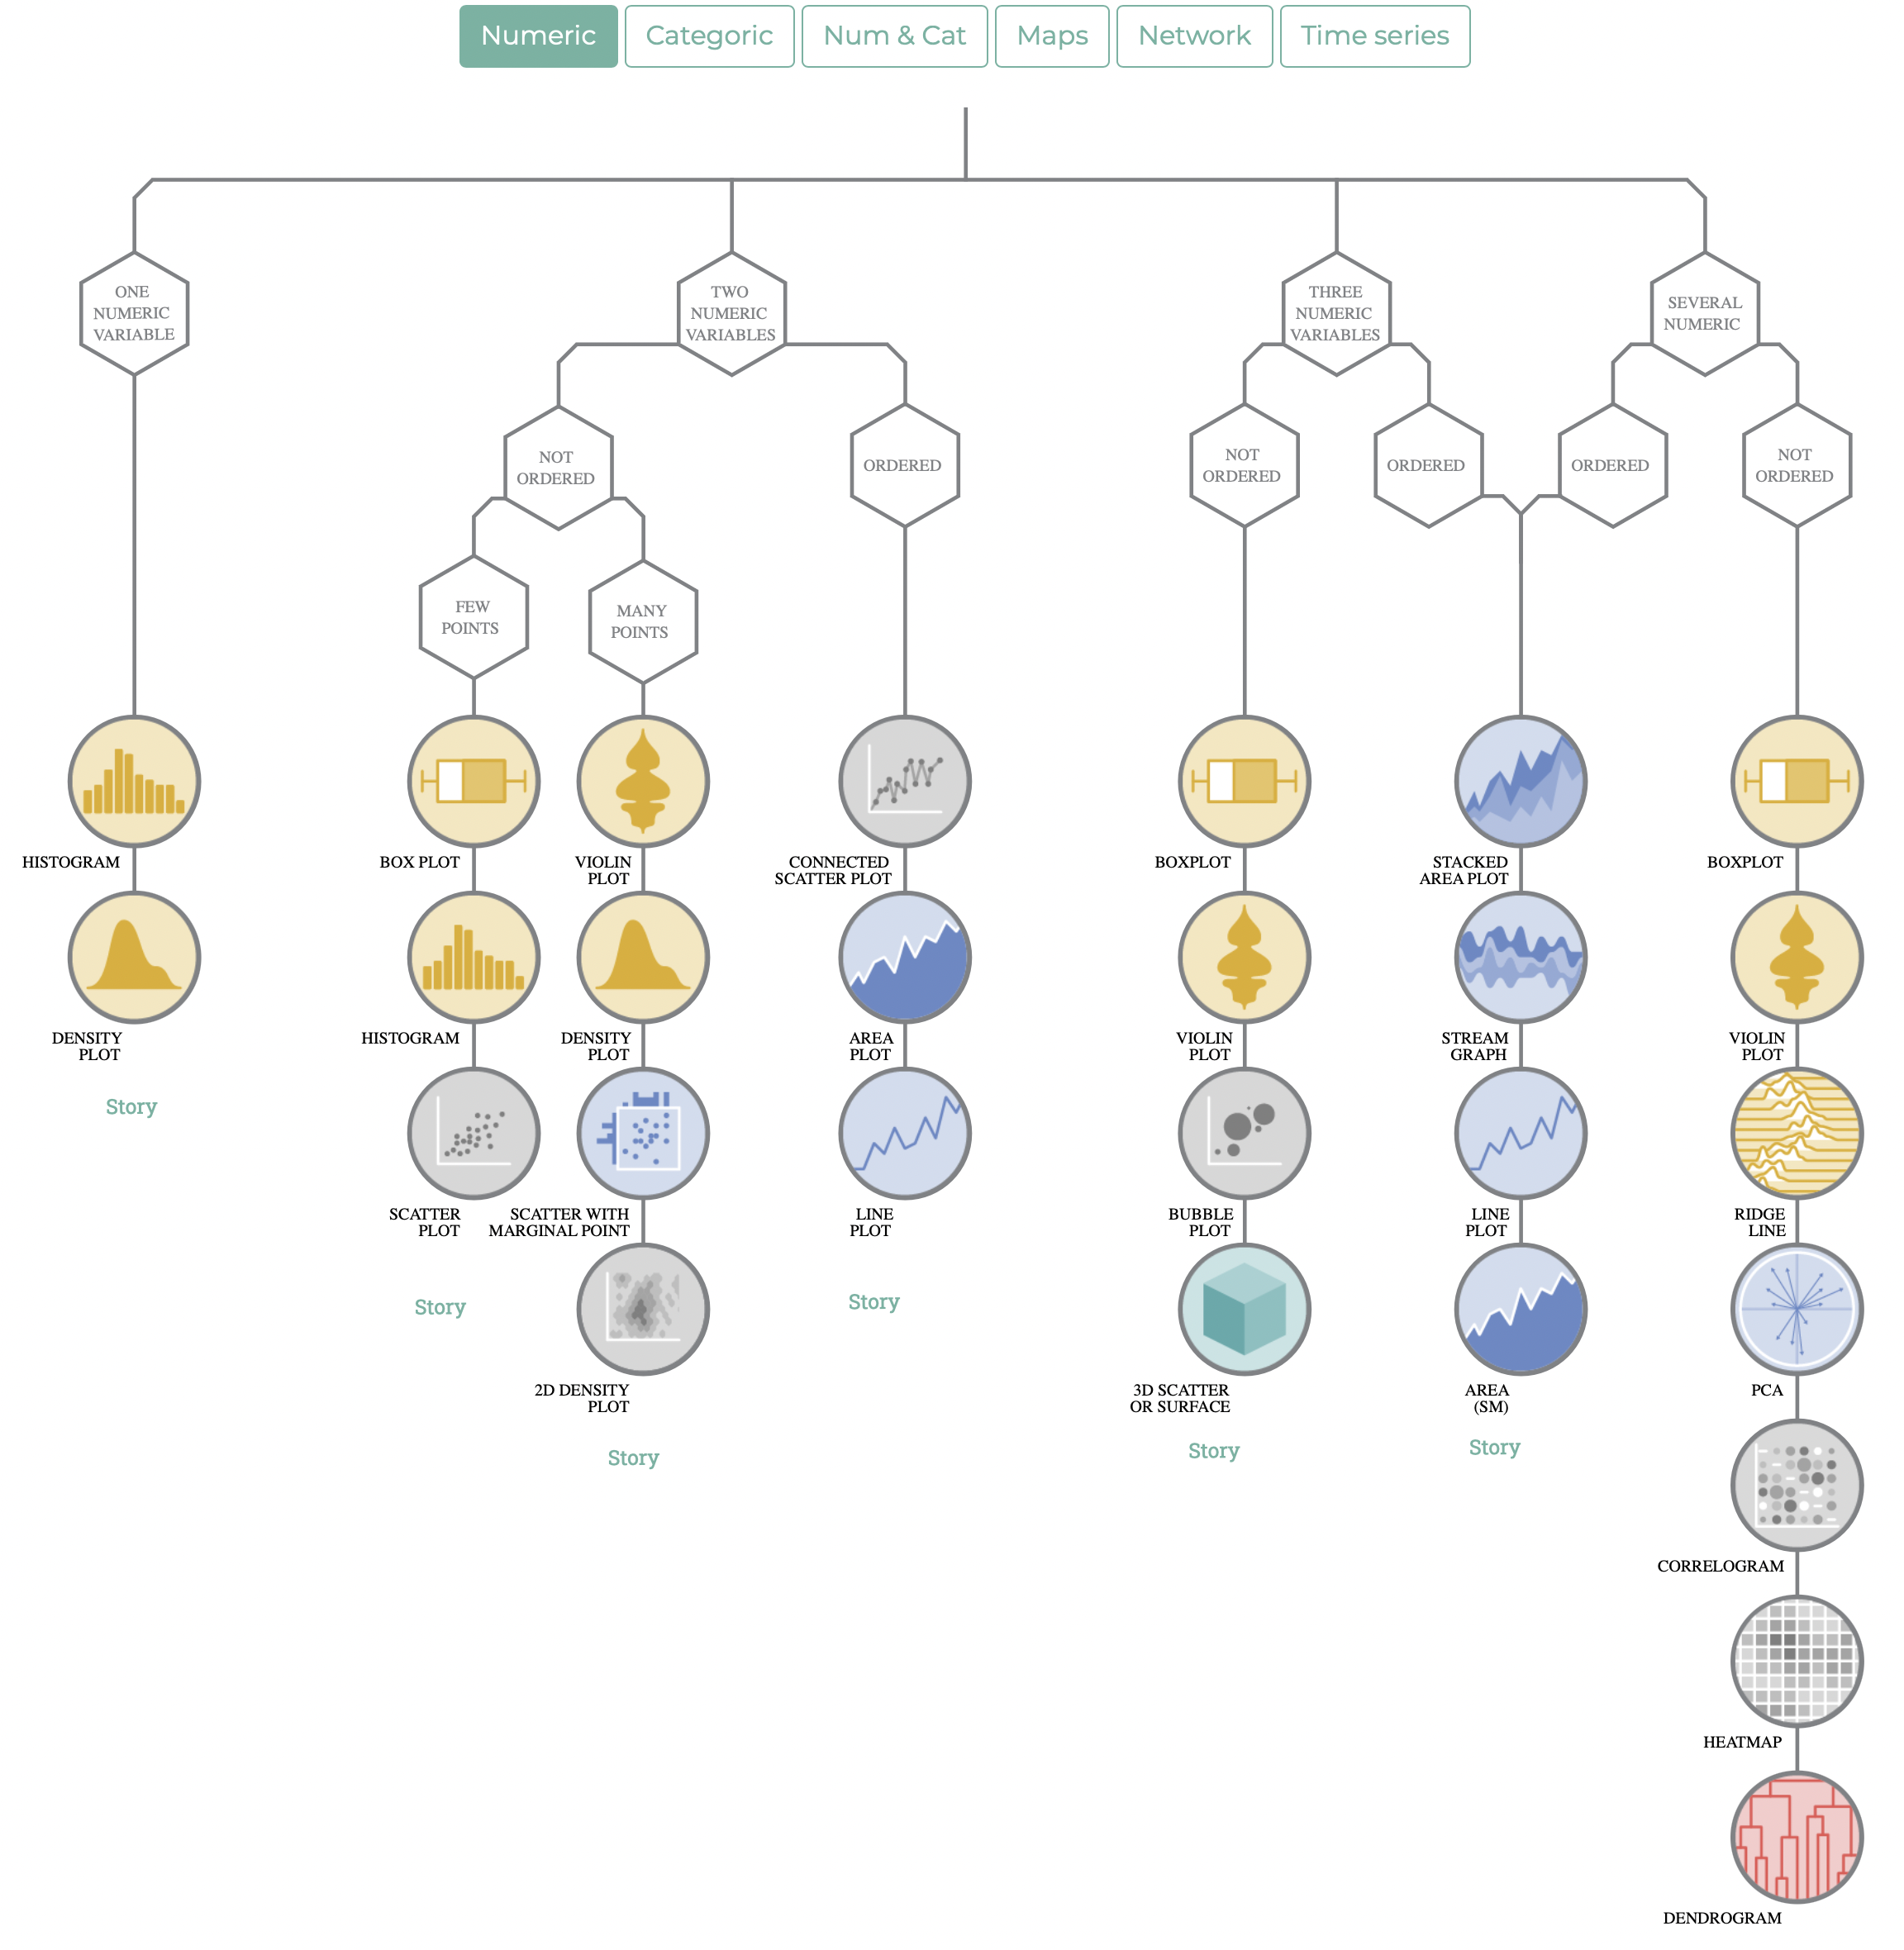
The Data to Viz gallery contains some 40 chart types, which can be browsed as a simple grid list, or as a hierarchy based on the data types needed to construct the charts.
Source: Maarten Lambrechts, CC BY SA 4.0
Source: data-to-viz.com
Unique to Data to Viz is that each chart type in the collections not only has a short description, but also a list with common mistakes associated with each chart type.
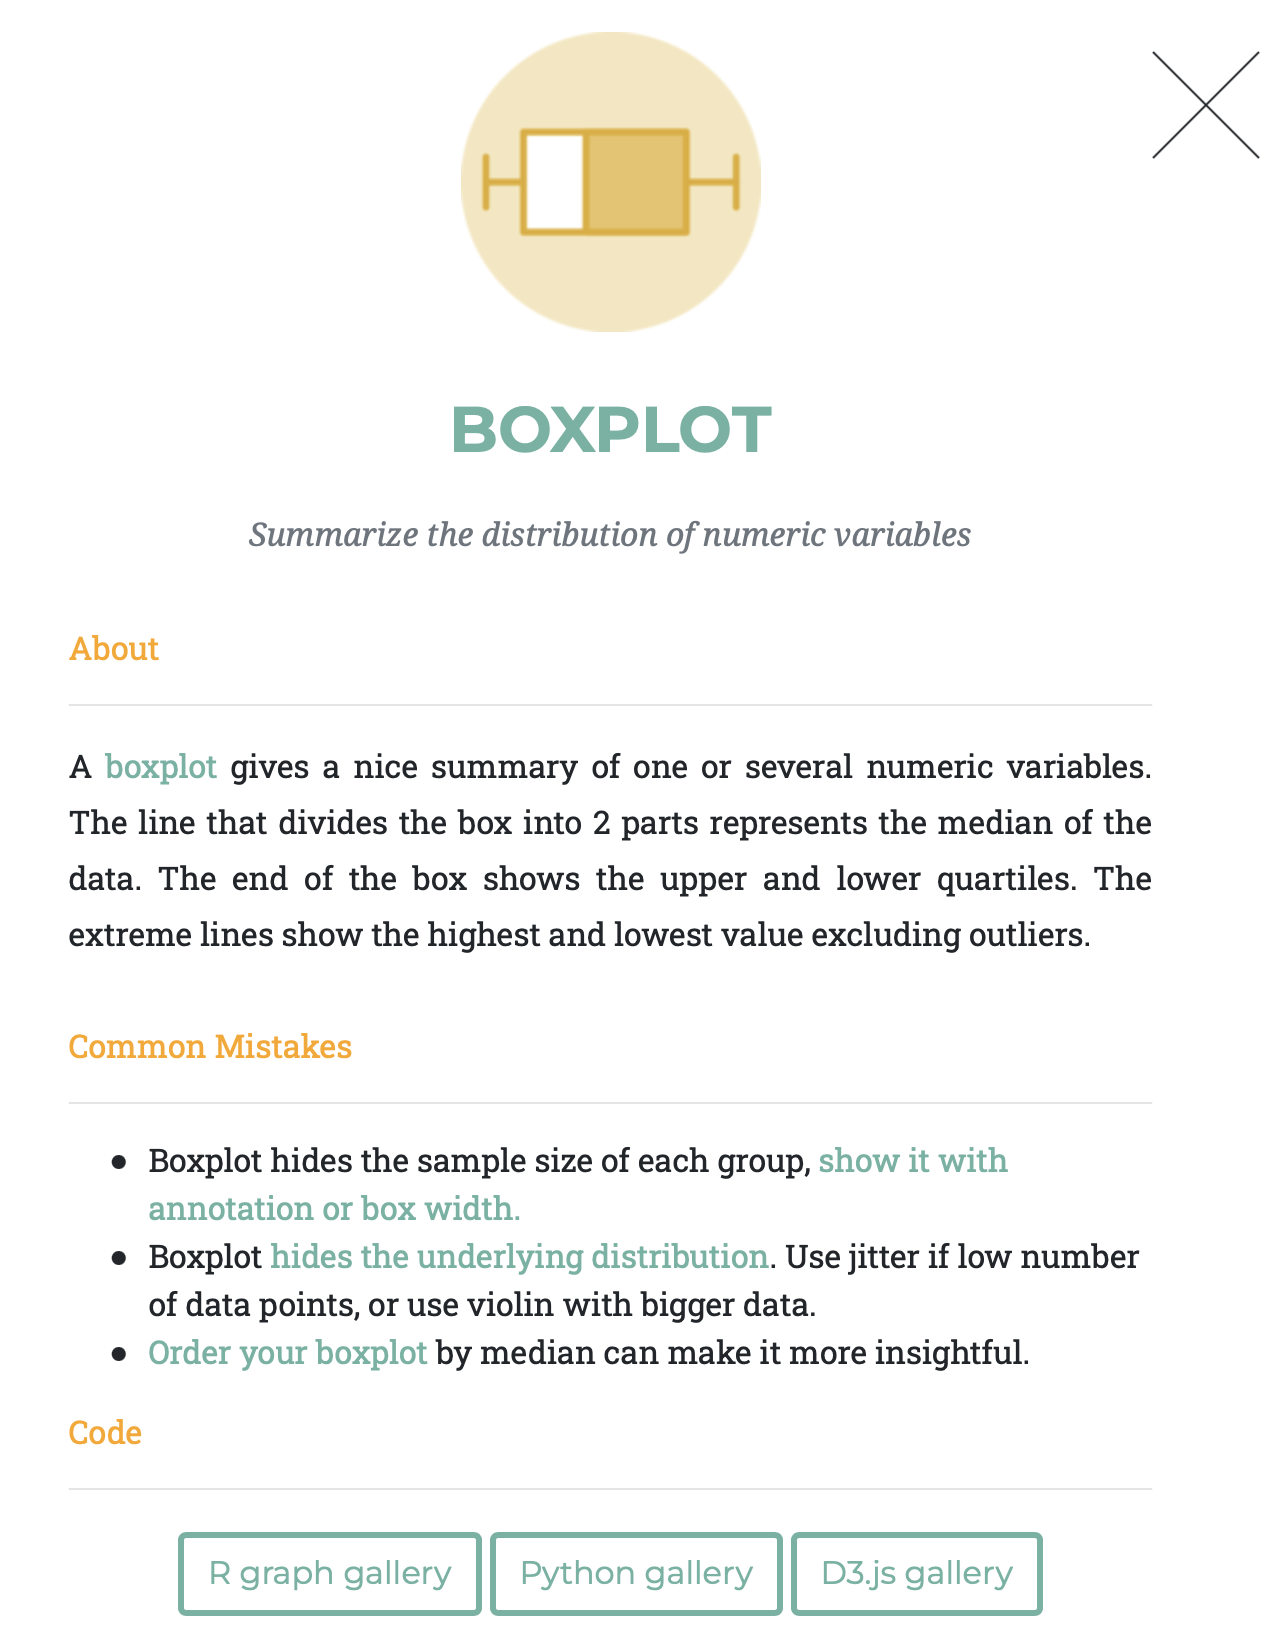
Source: data-to-viz.com
All the caveats are also collected on a dedicated page. But even more interesting is that Data to Viz is actually a portal to 3 mirror sites: each chart type has links to its sister page on
- r-graph-gallery.com, which contains sample code to make the visualisation in R
- python-graph-gallery, with Python sample code to produce the chart type
- d3-graph-gallery, with javascript and D3.js code to make the visualisation
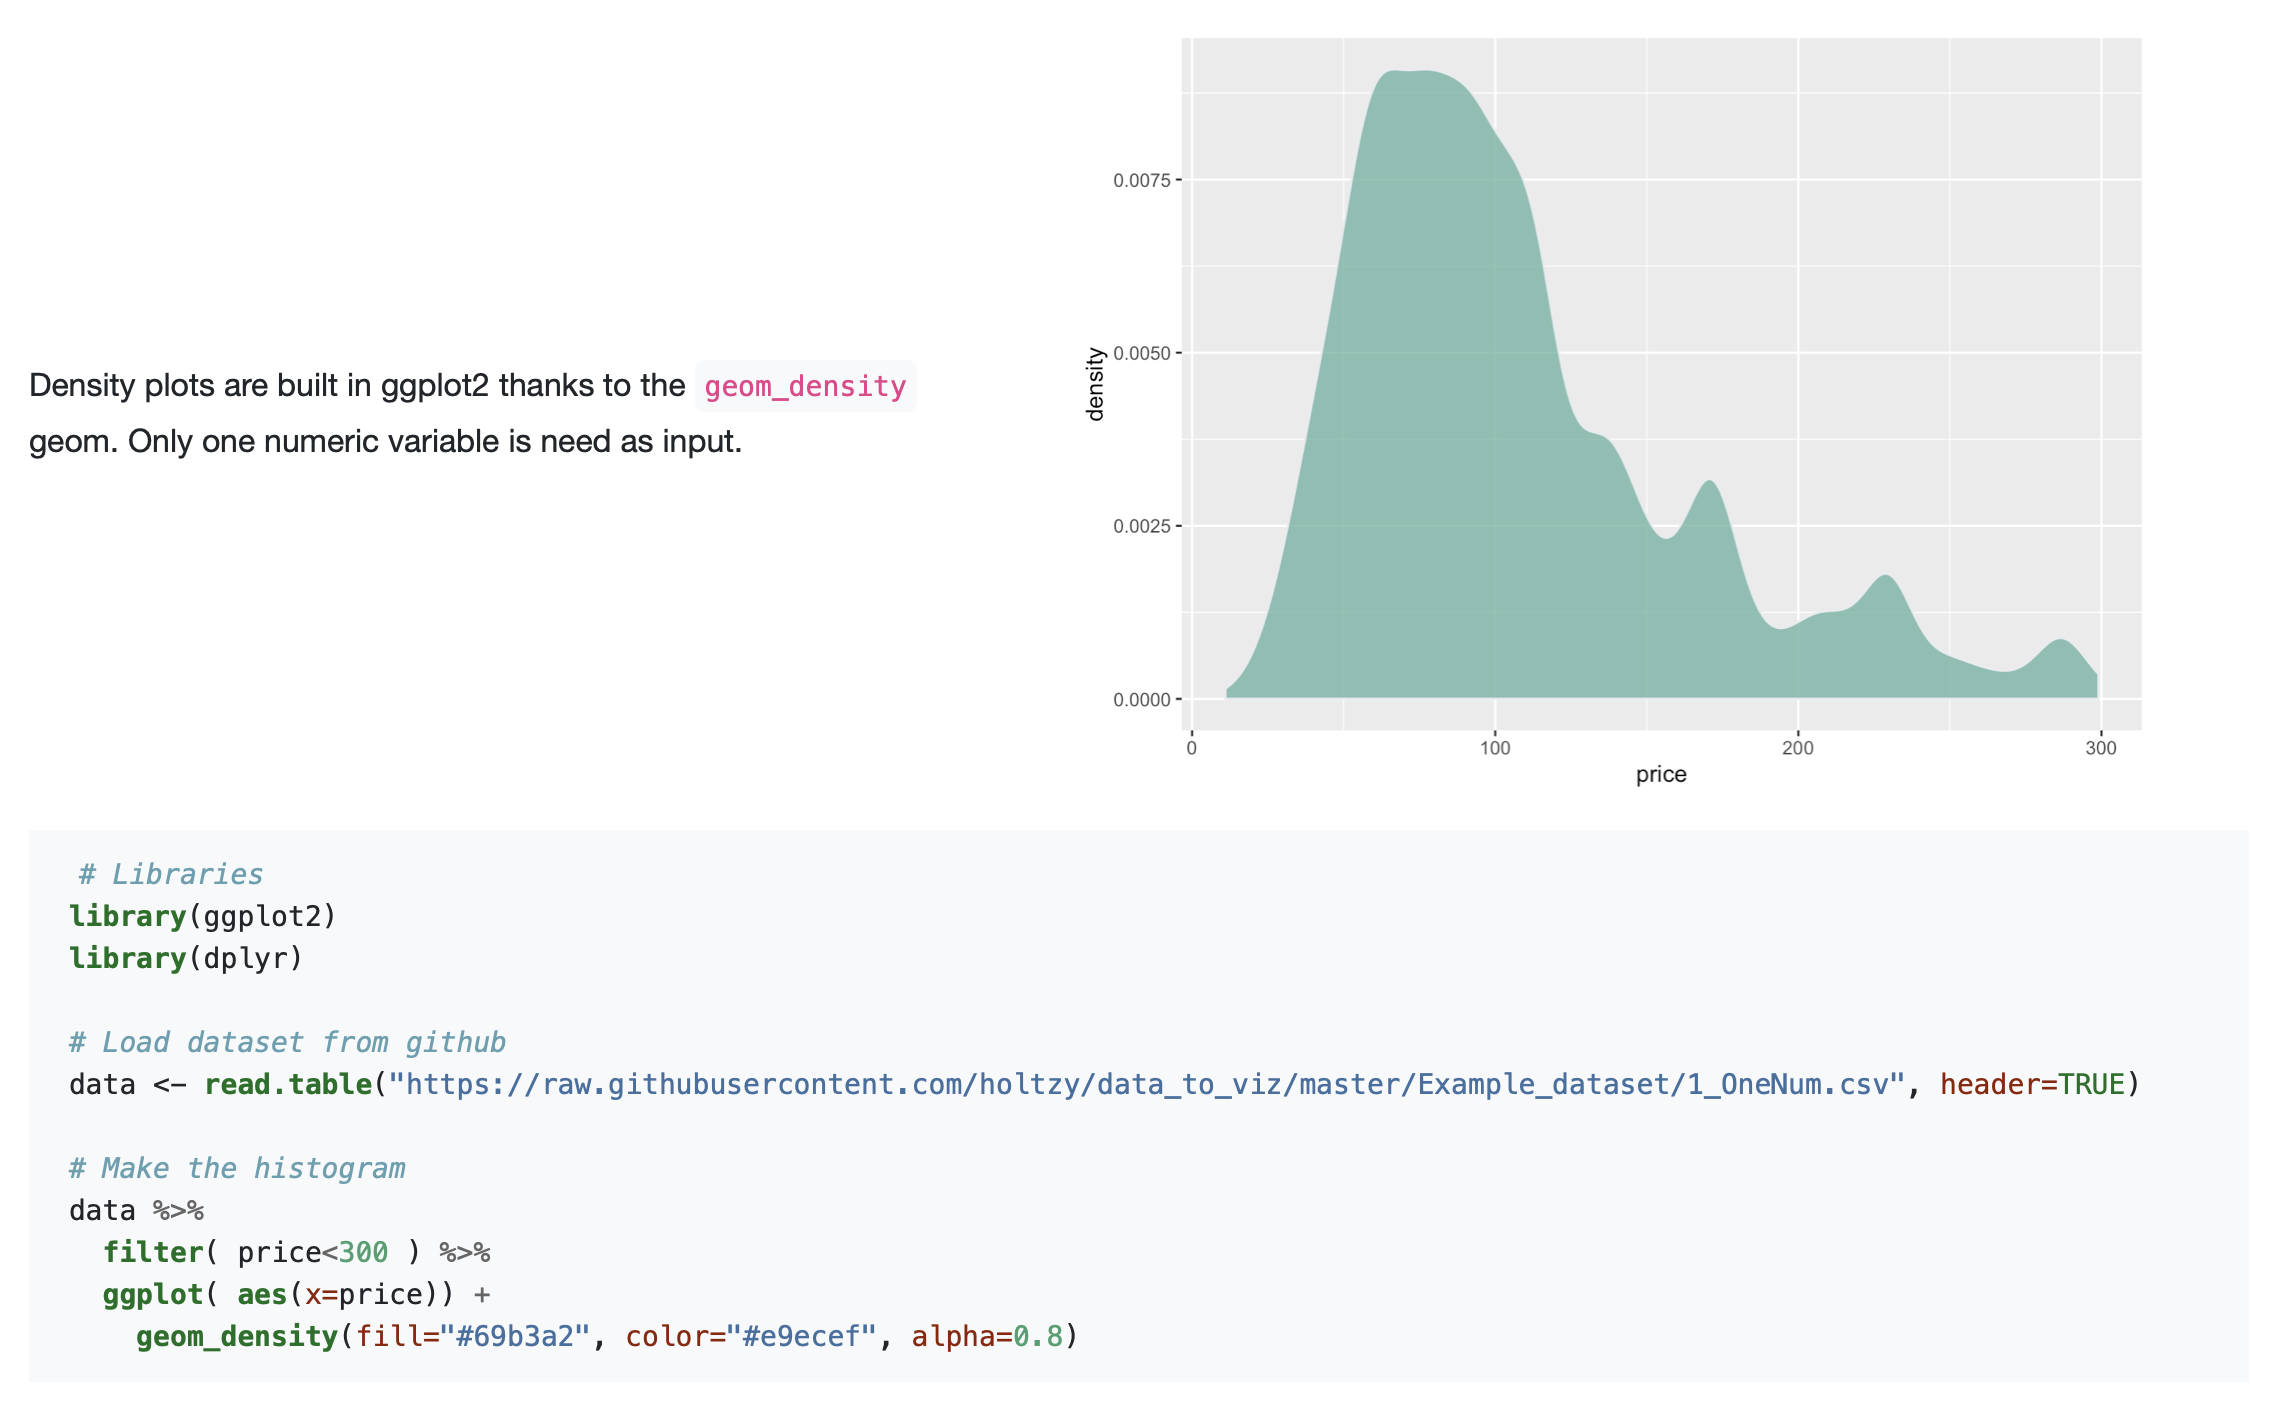
R code snippet to generate a density plot. Source: r-graphs-gallery.com