The Chartmaker Directory is a collection of 38 visualisation tools, cross linked with the types of visualisations they are able to produce. In the Chartmaker Directory’s matrix, you will find links to charts produced with the different tools, as well as links to tutorials that explain how to produce them.
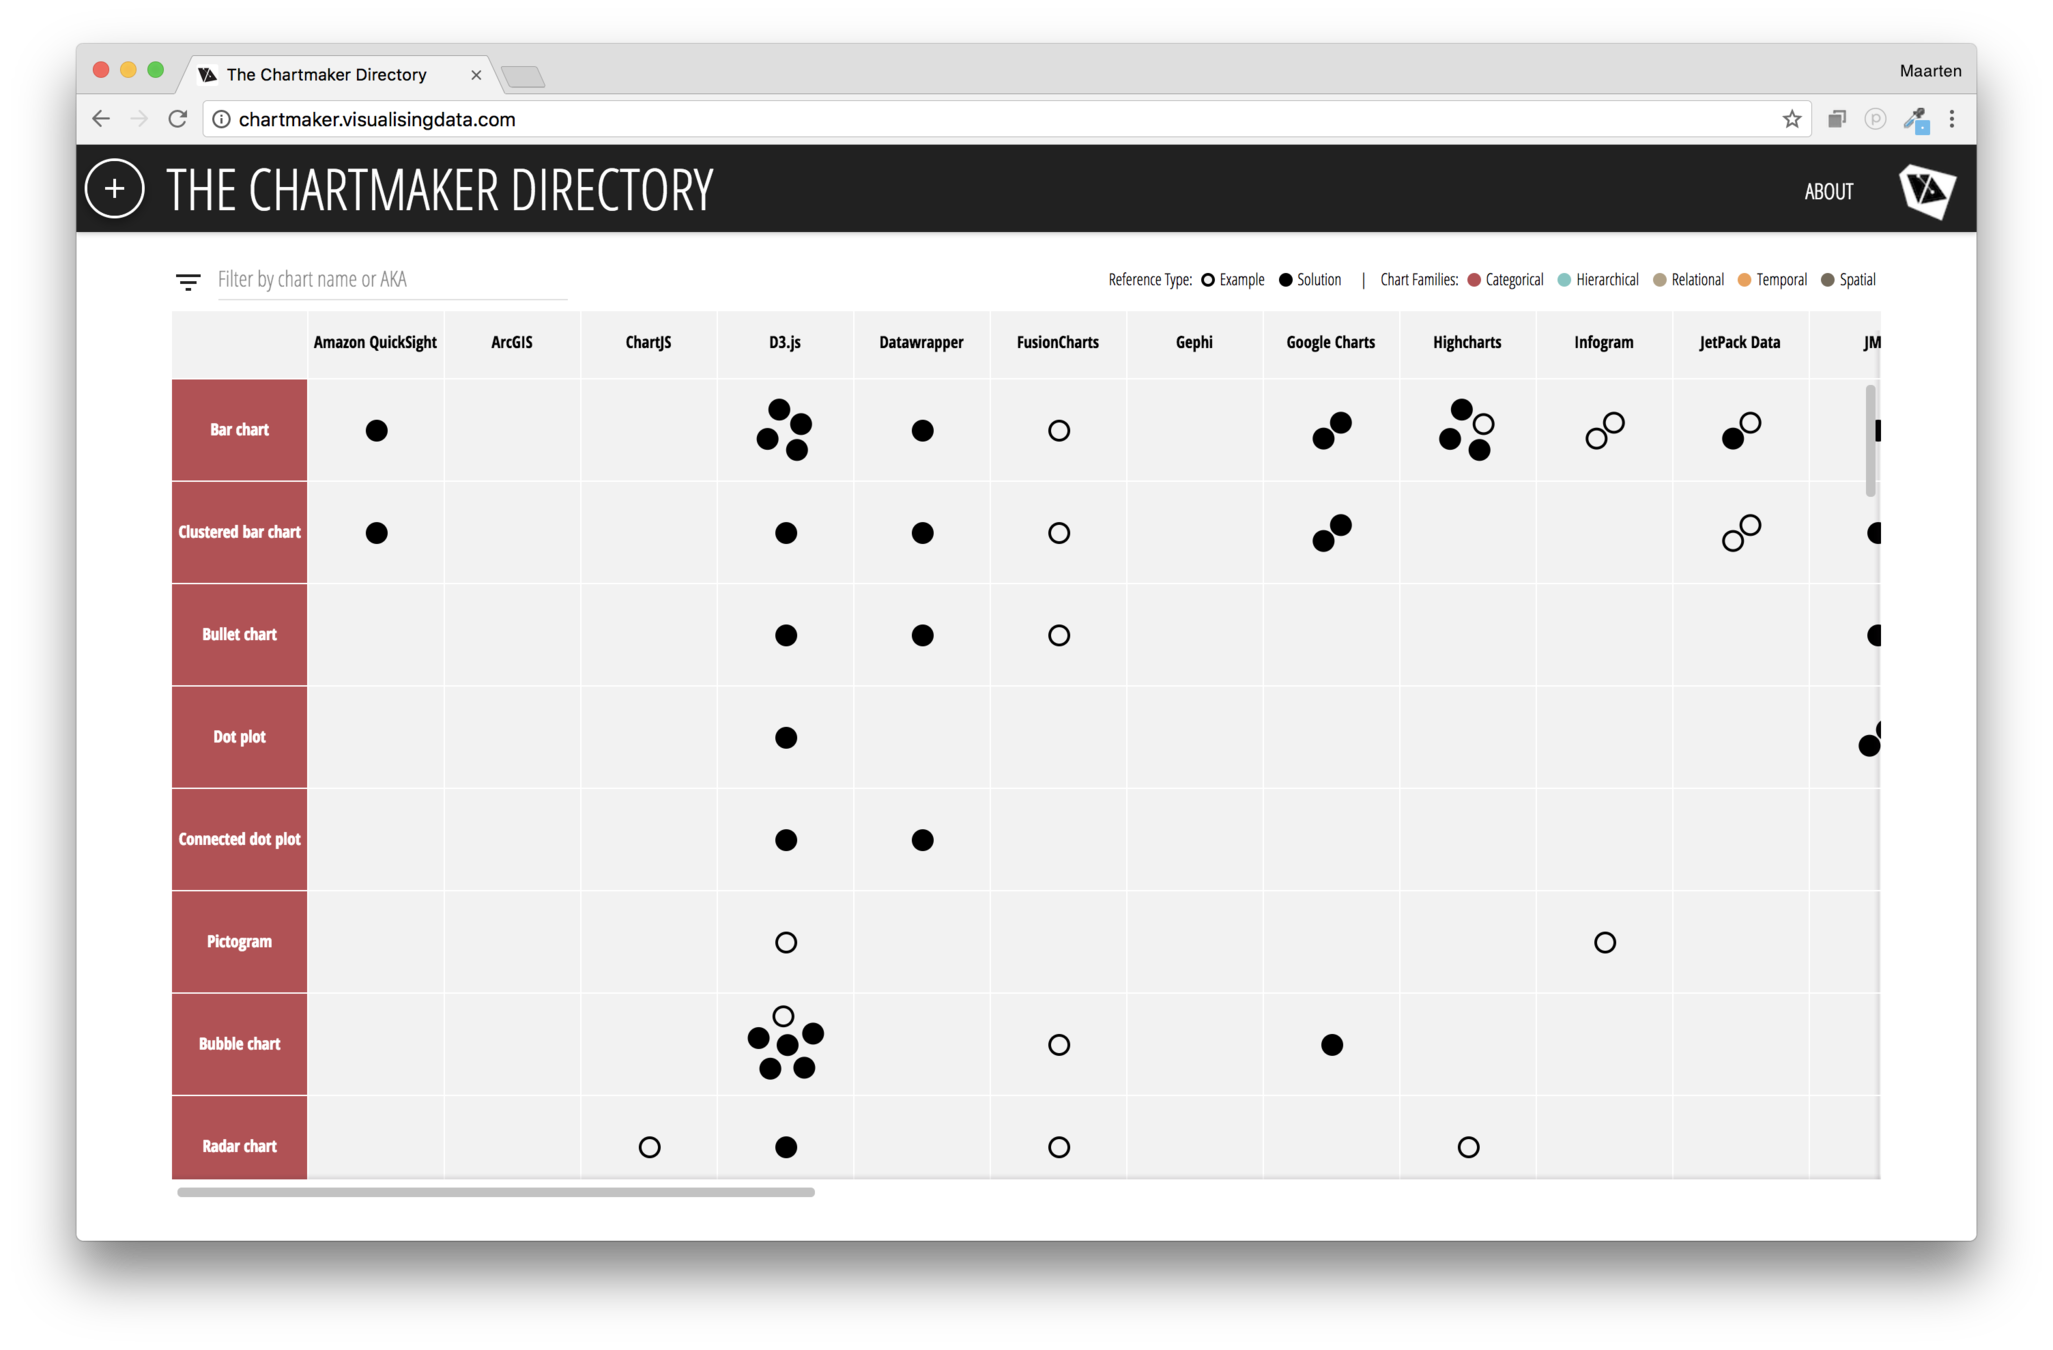
Source: Maarten Lambrechts, CC-BY-SA 4.0