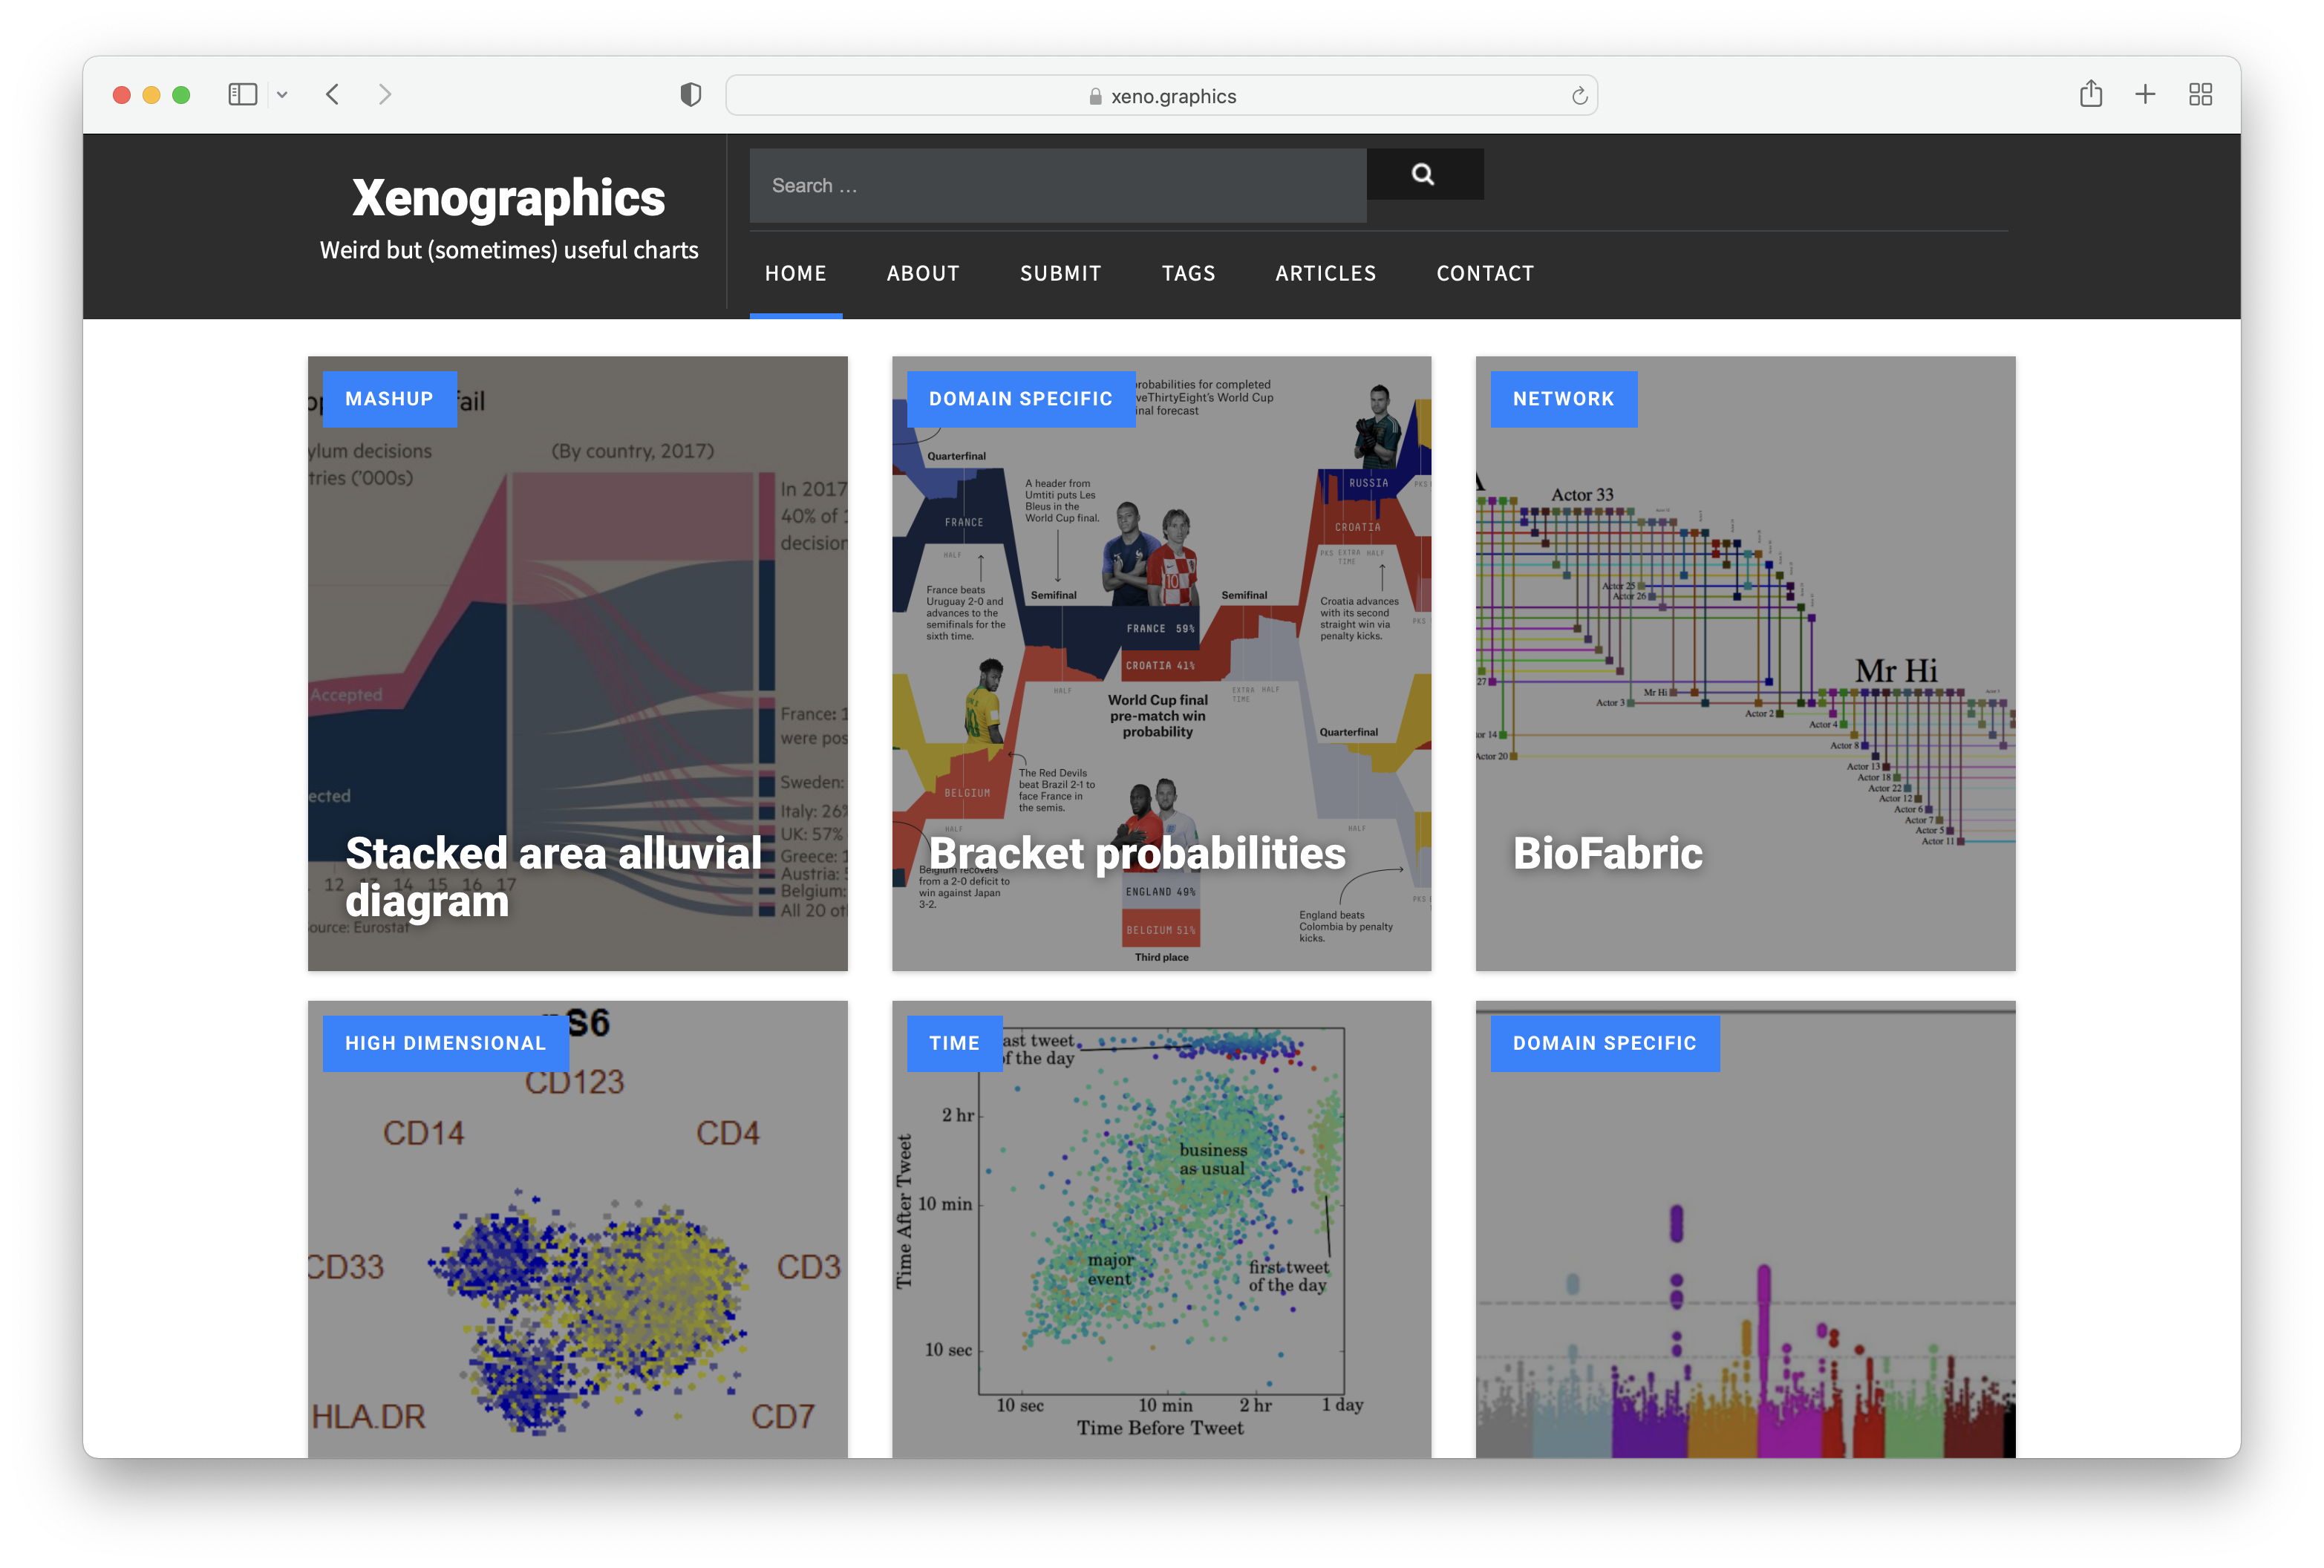
Xenographics is a collection of weird but (sometimes) useful charts, curated by Maarten Lambrechts. The aim of the collection is to show novel, innovative and experimental visualisations that can be inspirational for visualising specific data sets.
Source: xeno.graphics
Each visualisation in the collection has a small description and a link to the source.
Source: xeno.graphics