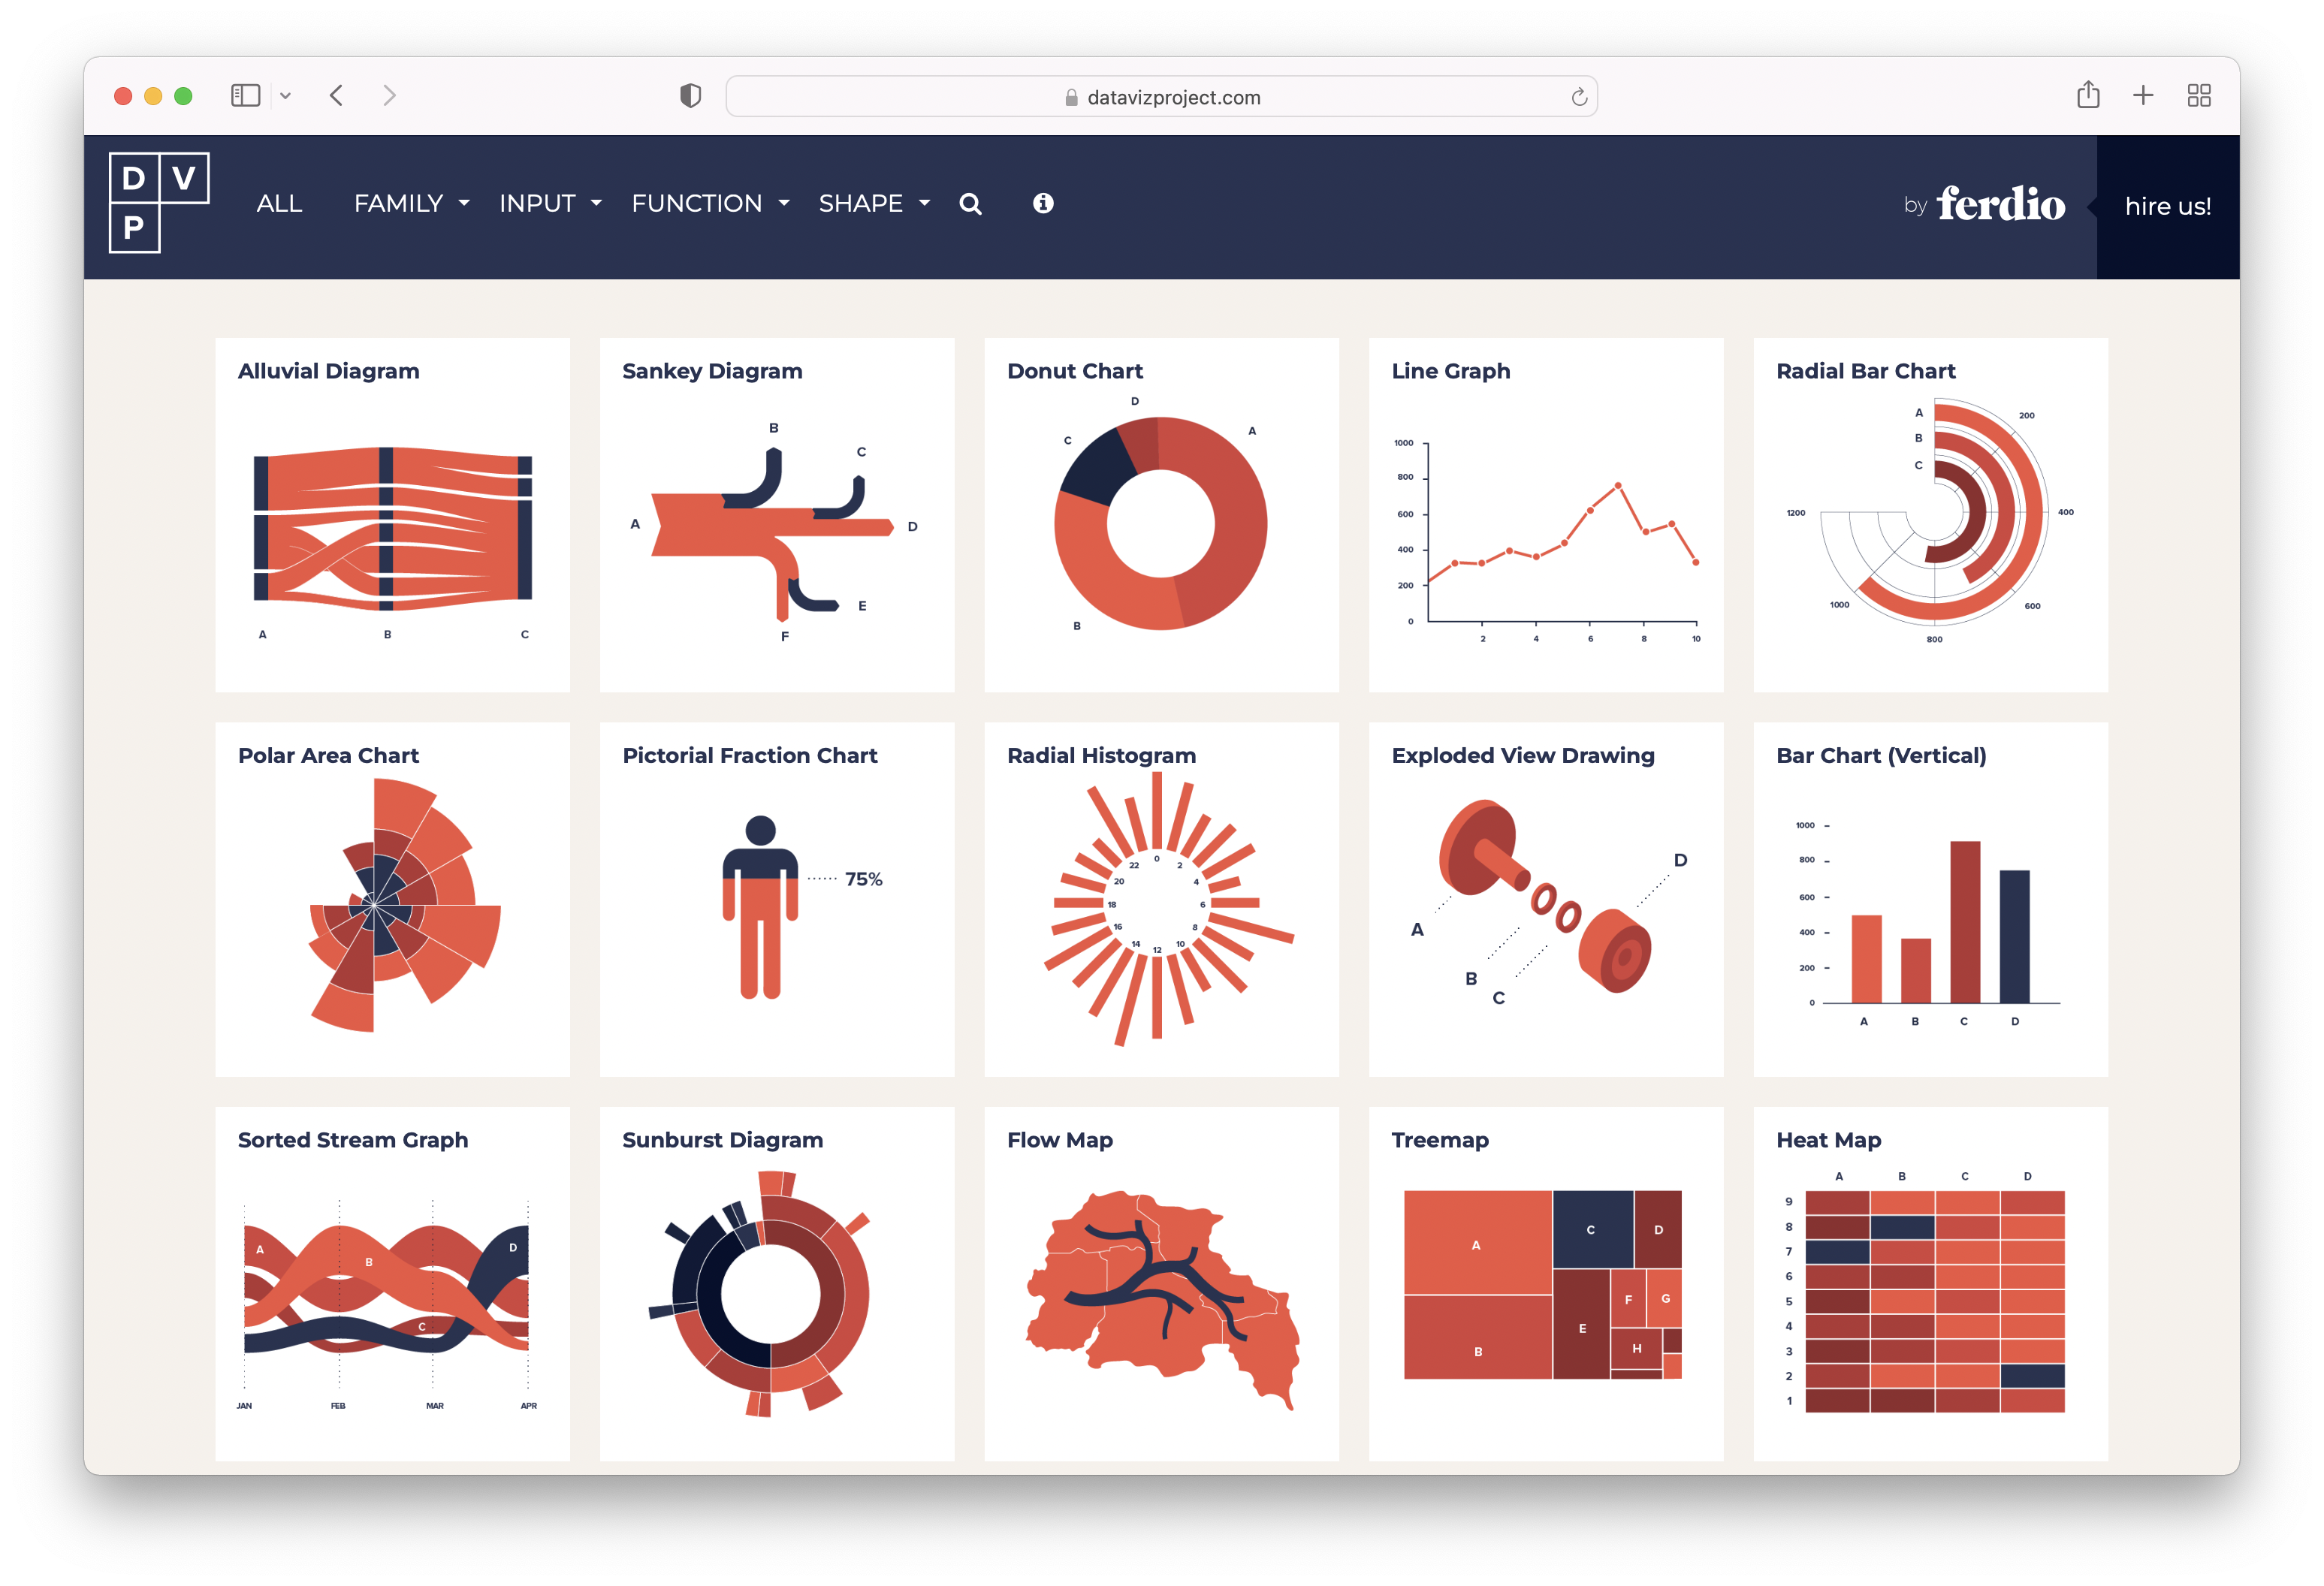
The Dataviz Project is a data visualisation collection with more than 160 chart types.
Source: Maarten Lambrechts, CC BY SA 4.0
The collection can be filtered by
- family: charts, diagrams, maps, …
- input: the type of data that is required to make the visualisation
- function: comparison, correlation, distribution, …
- shape: circular, grid, …
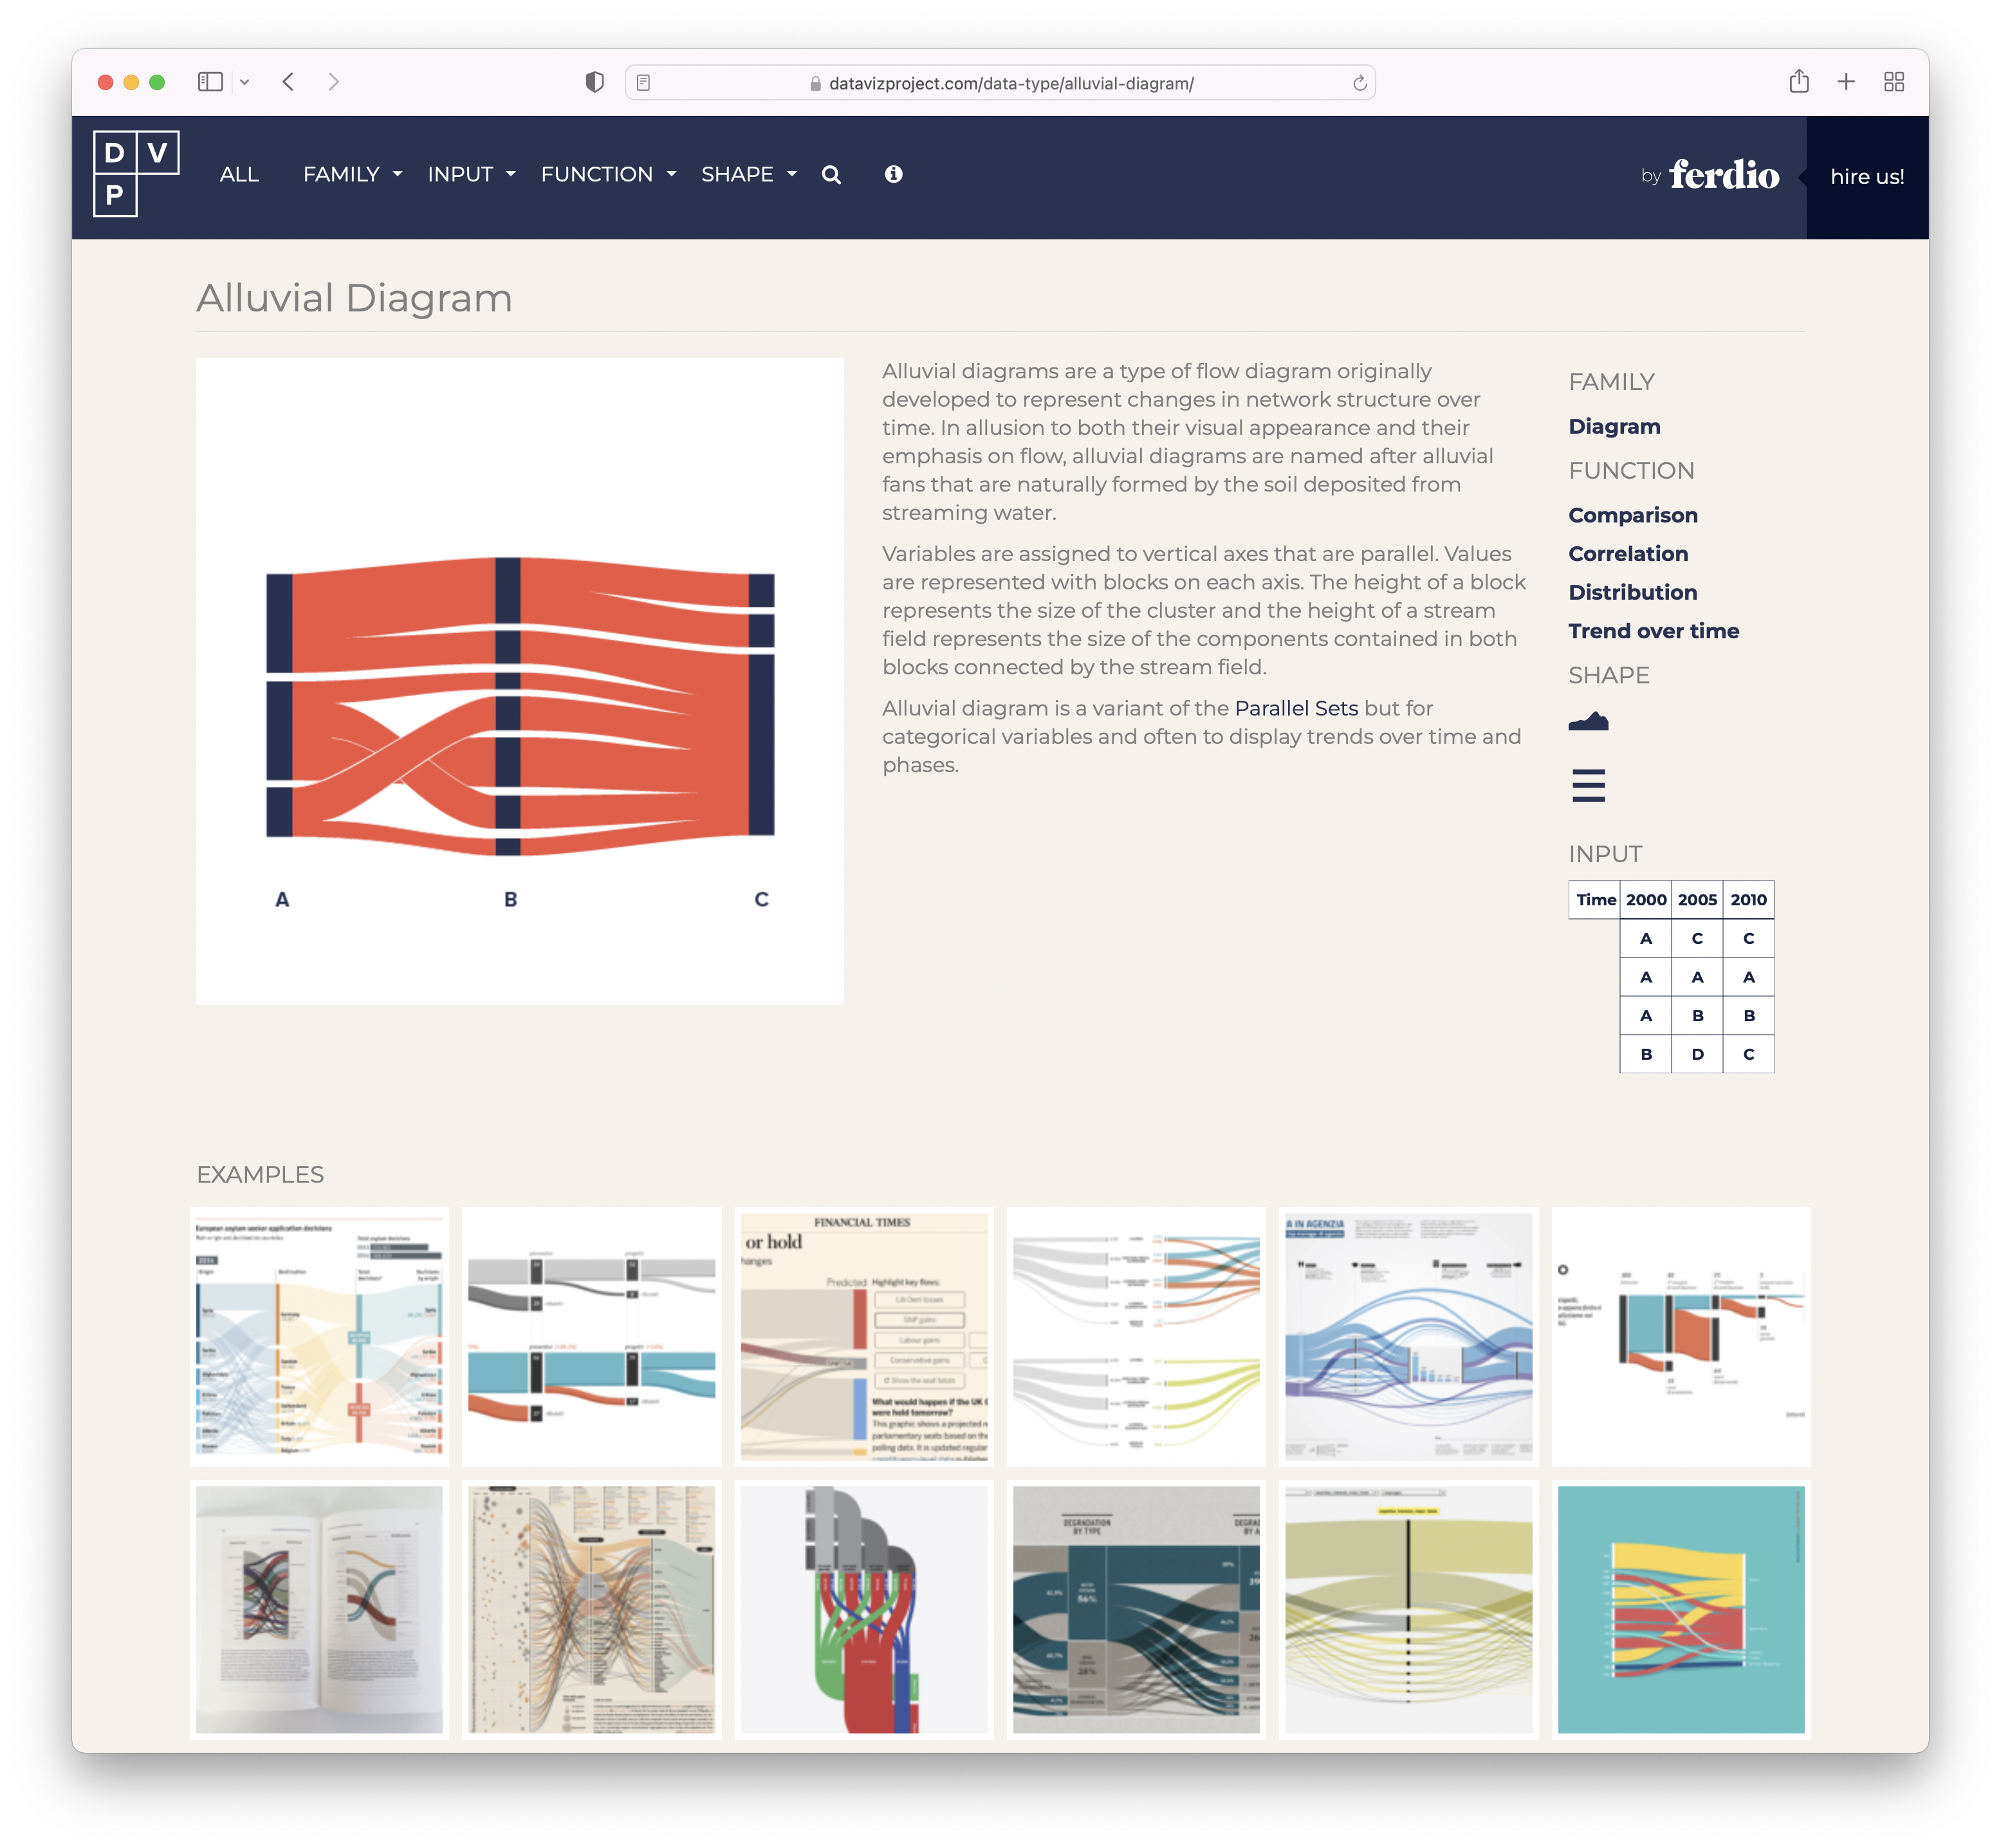
Each chart type has its own dedicated page, with a description of the chart type, and lists published examples of the chart type.
Source: Maarten Lambrechts, CC BY SA 4.0