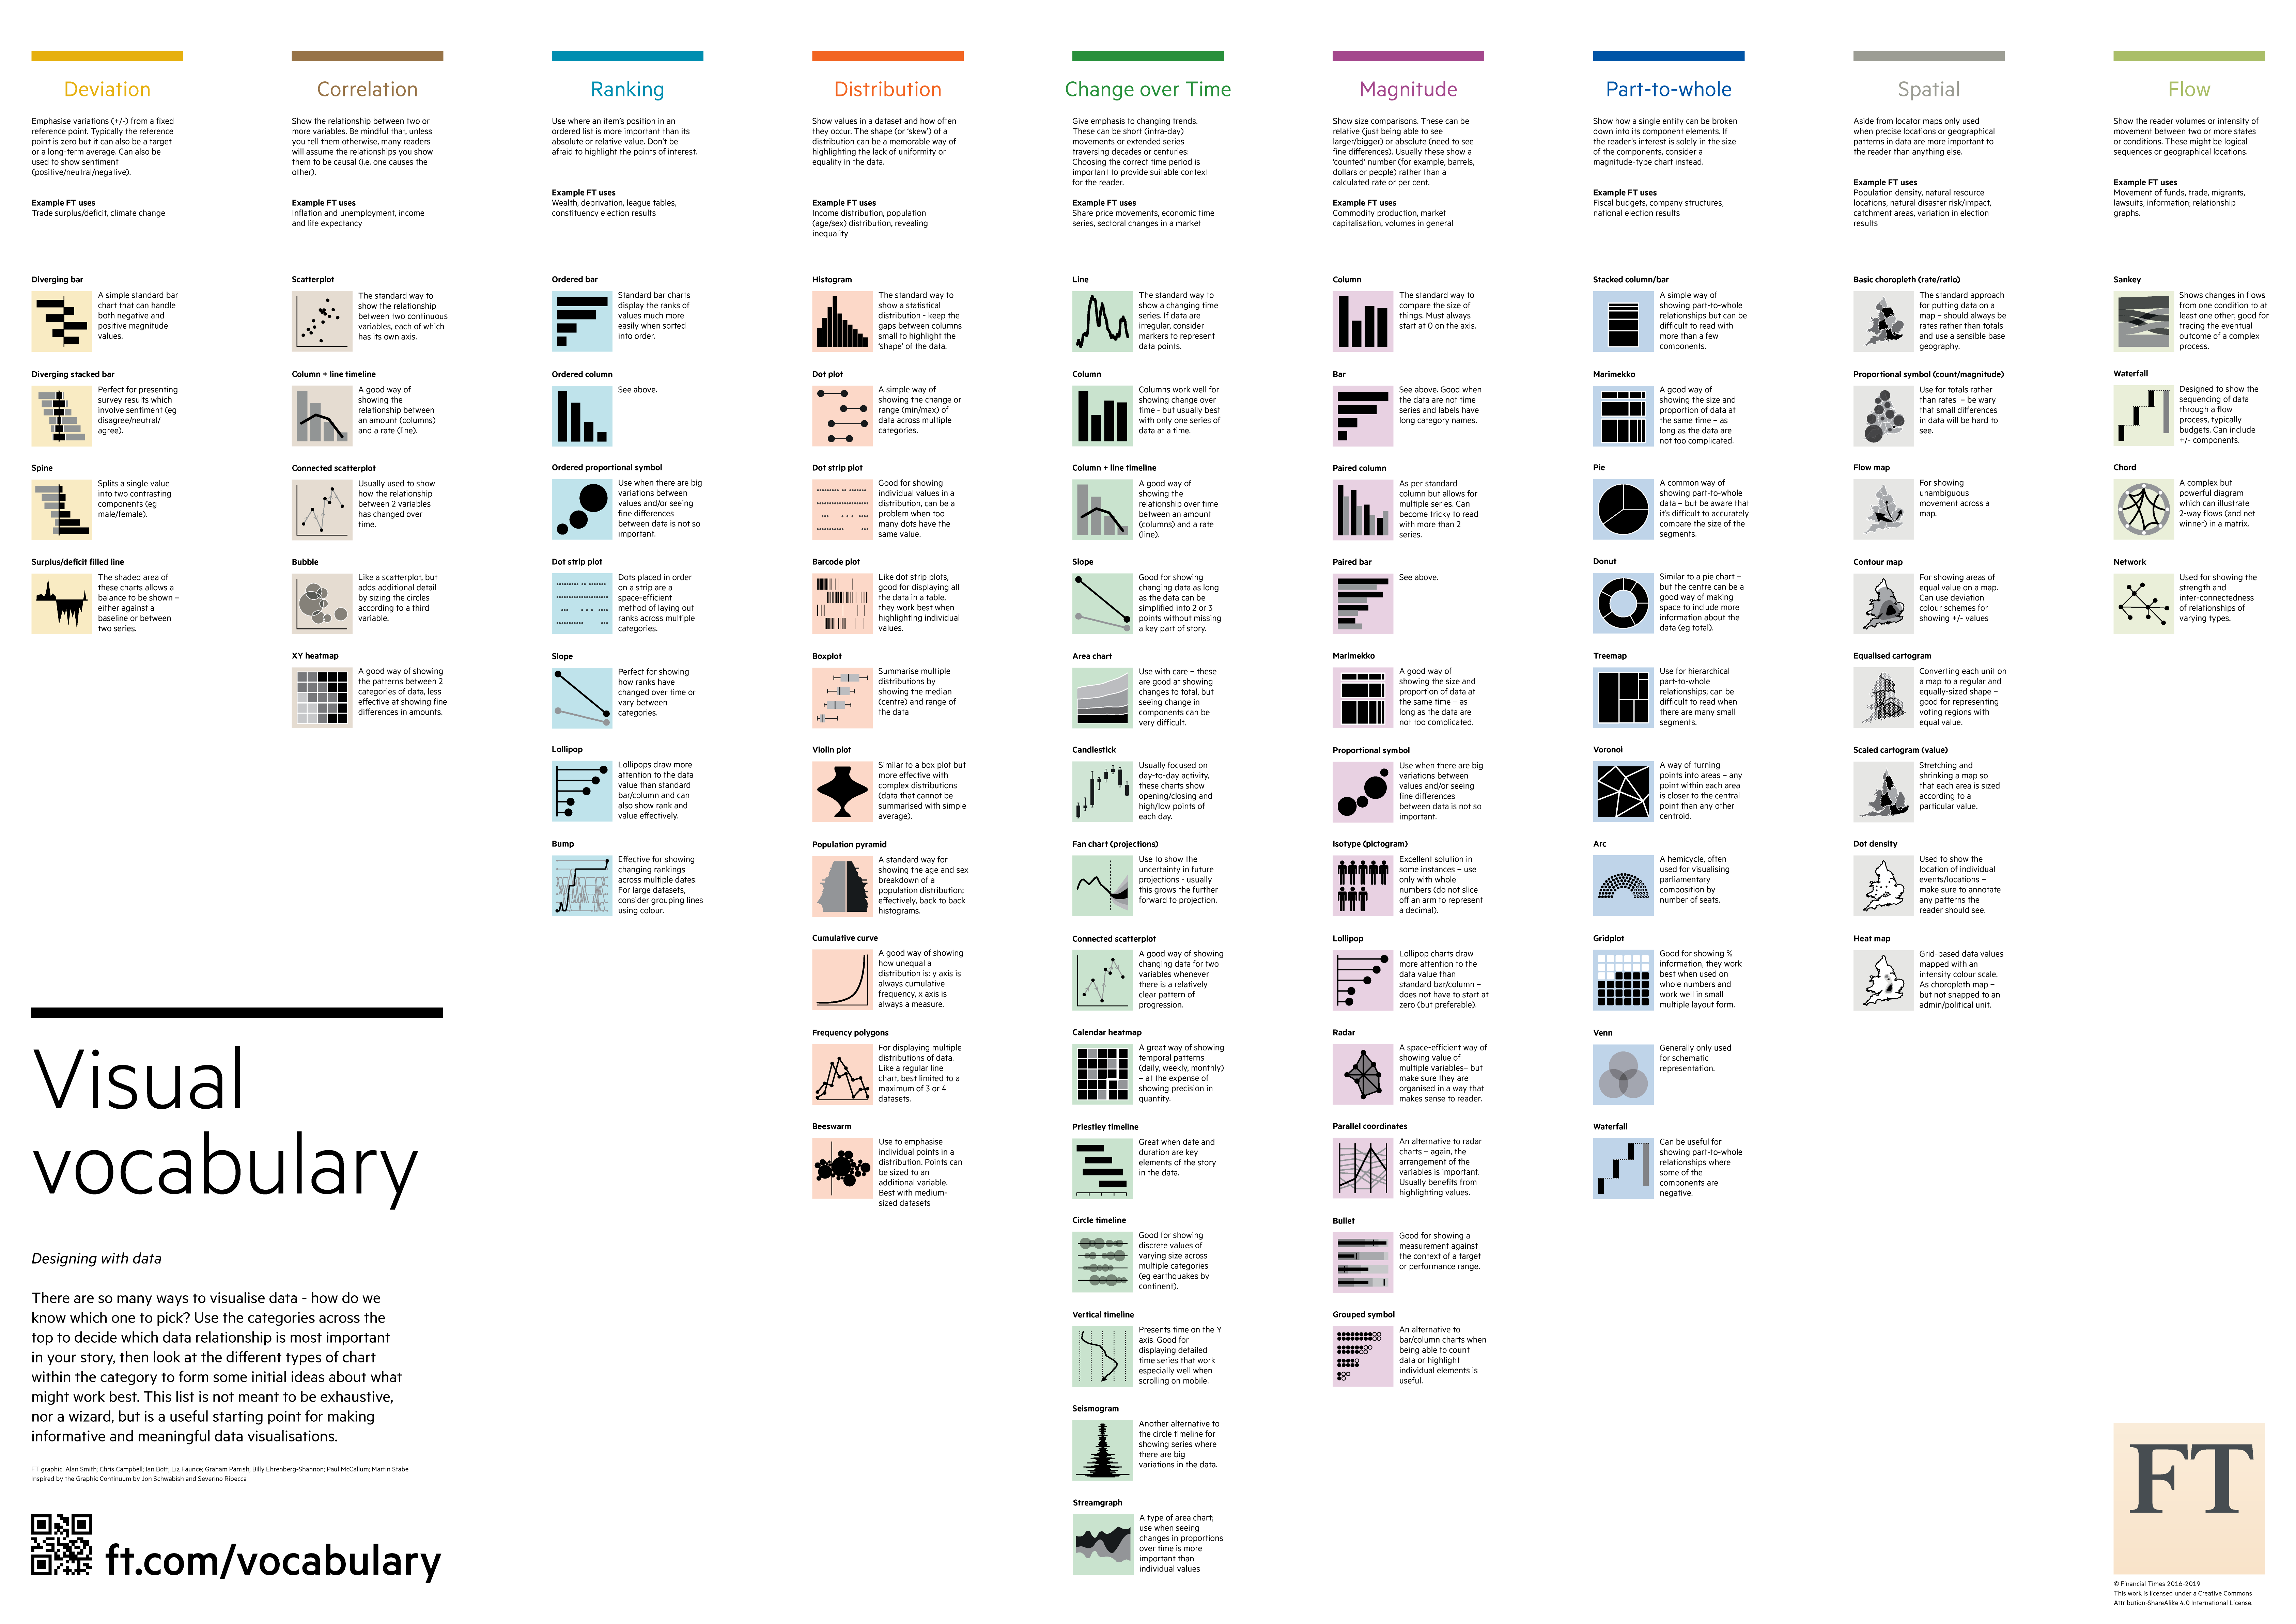
The Visual Vocabulary is a set of chart types organised by what aspects of your data the chart type can show best.
Source: ft.com/vocabulary
The Visual Vocabulary was designed by the graphics desk of the Financial Times, and exists both as a poster and as a web page. The main goal of developing the Vocabulary was to have a common language to discuss the best chart type to use for charts to be added to Financial Times articles.