Next to patterns in the data itself, storytelling in data visualisation can also be achieved by presenting data using a specific view on it.
A common view pattern is putting 2 contrasting views next to each other, to highlight differences.
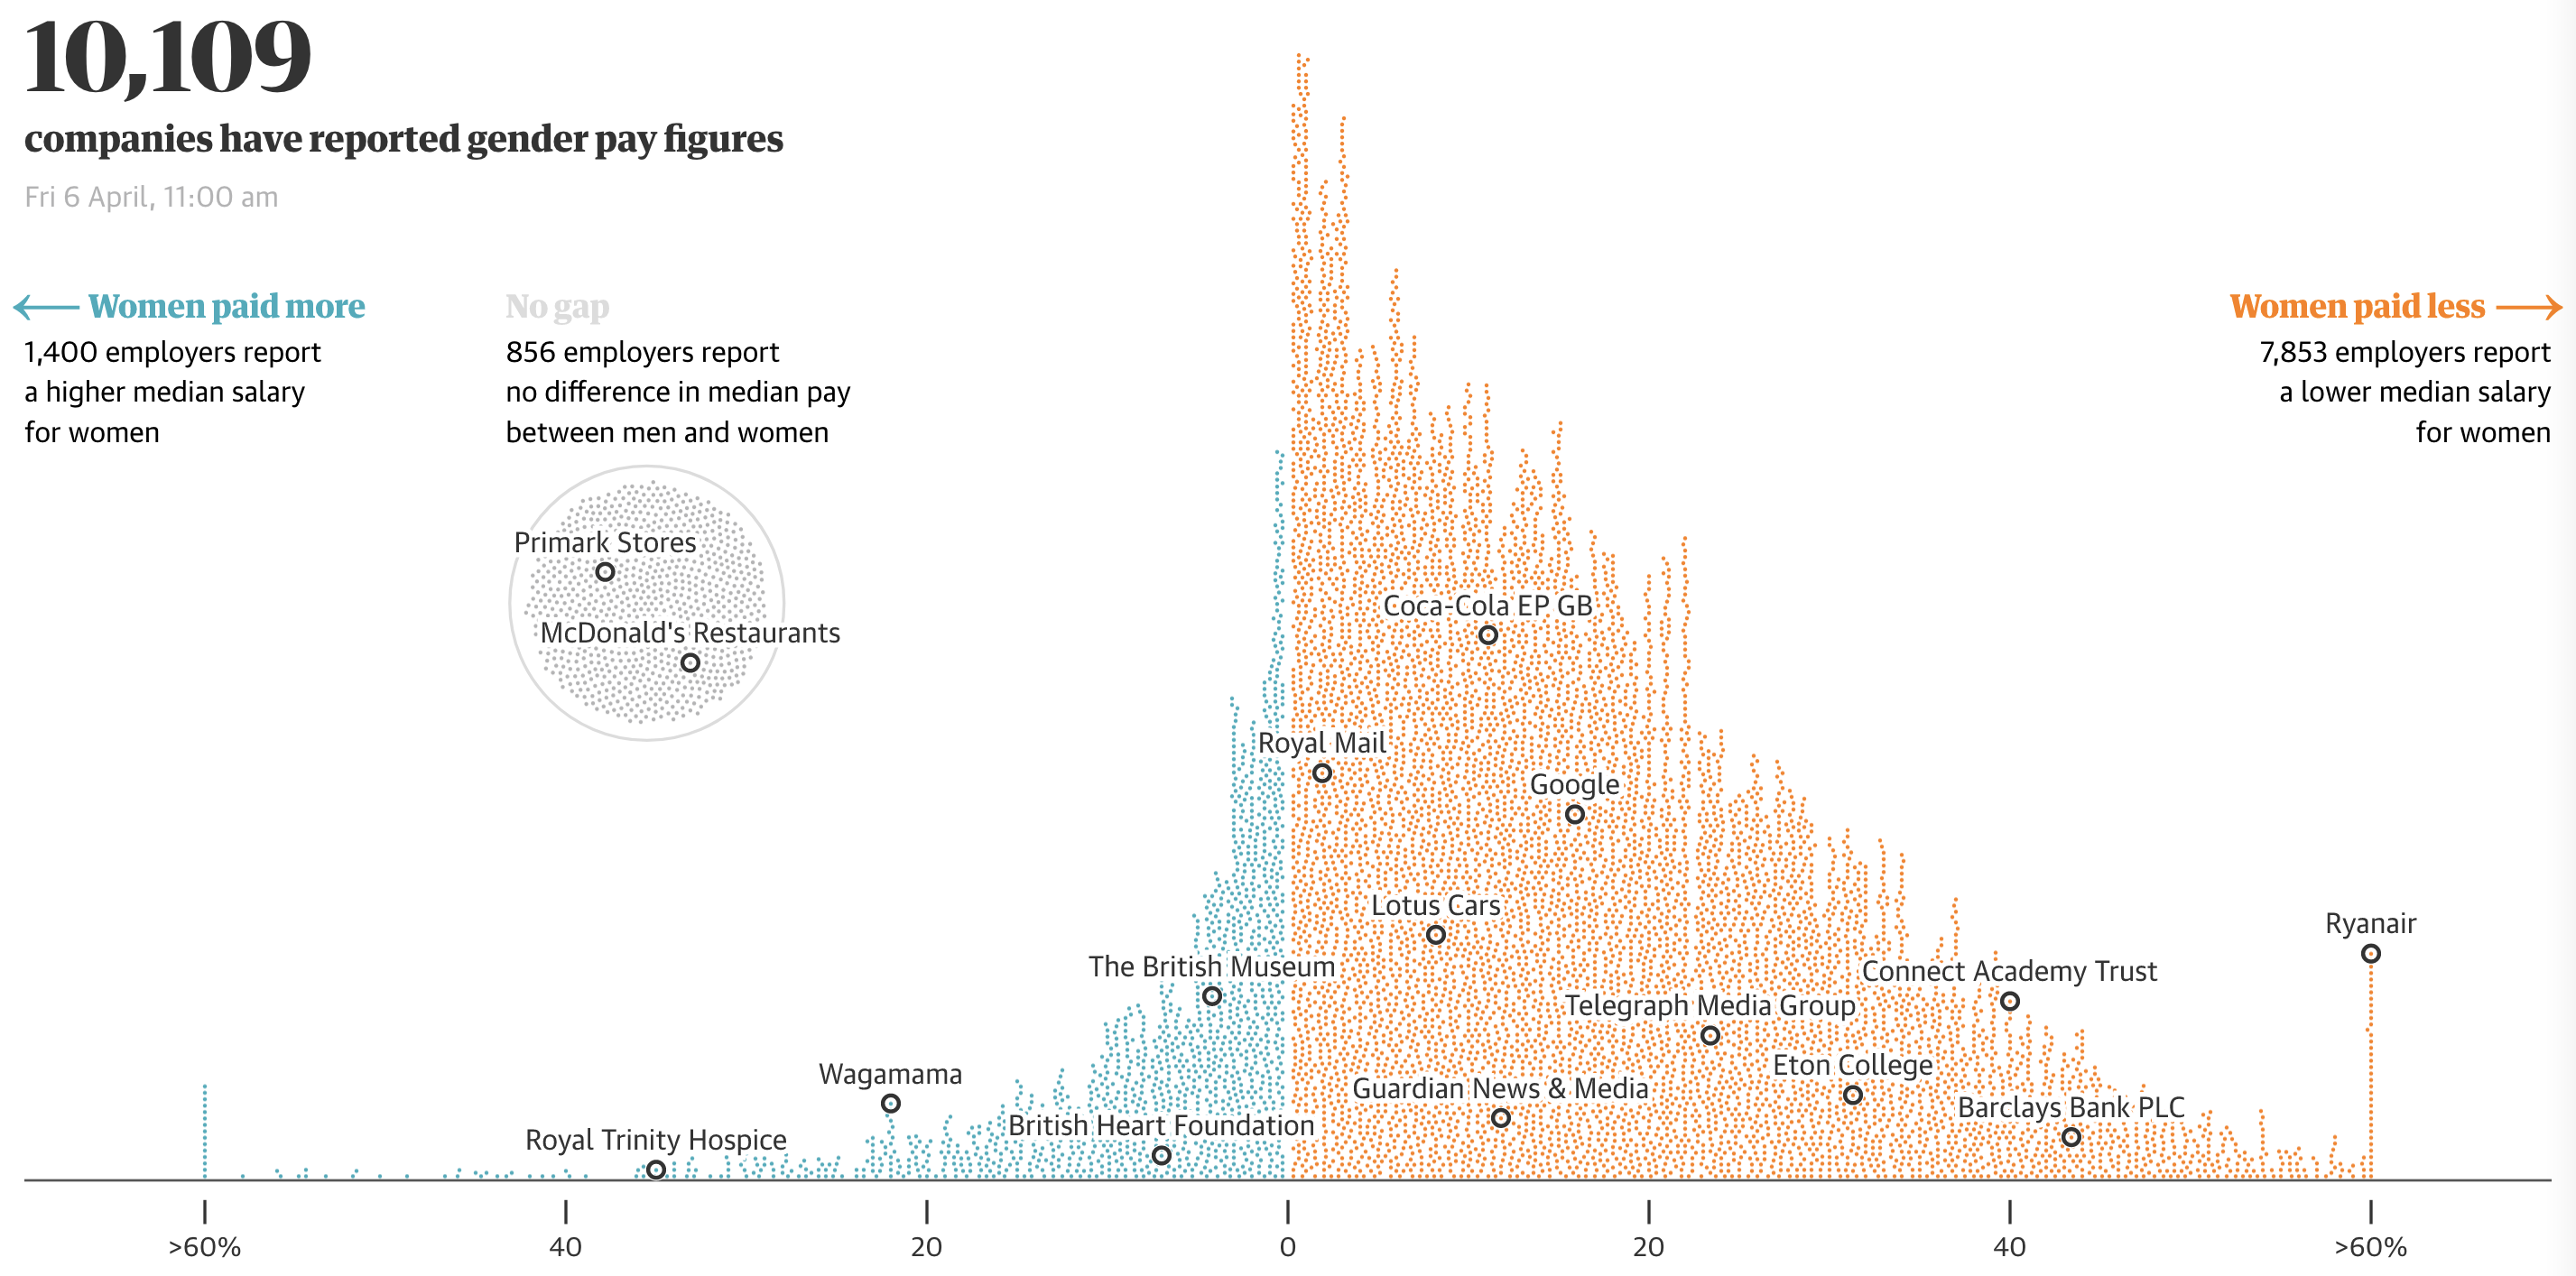
Source: Gender pay gap: what we learned and how to fix it, theguardian.com
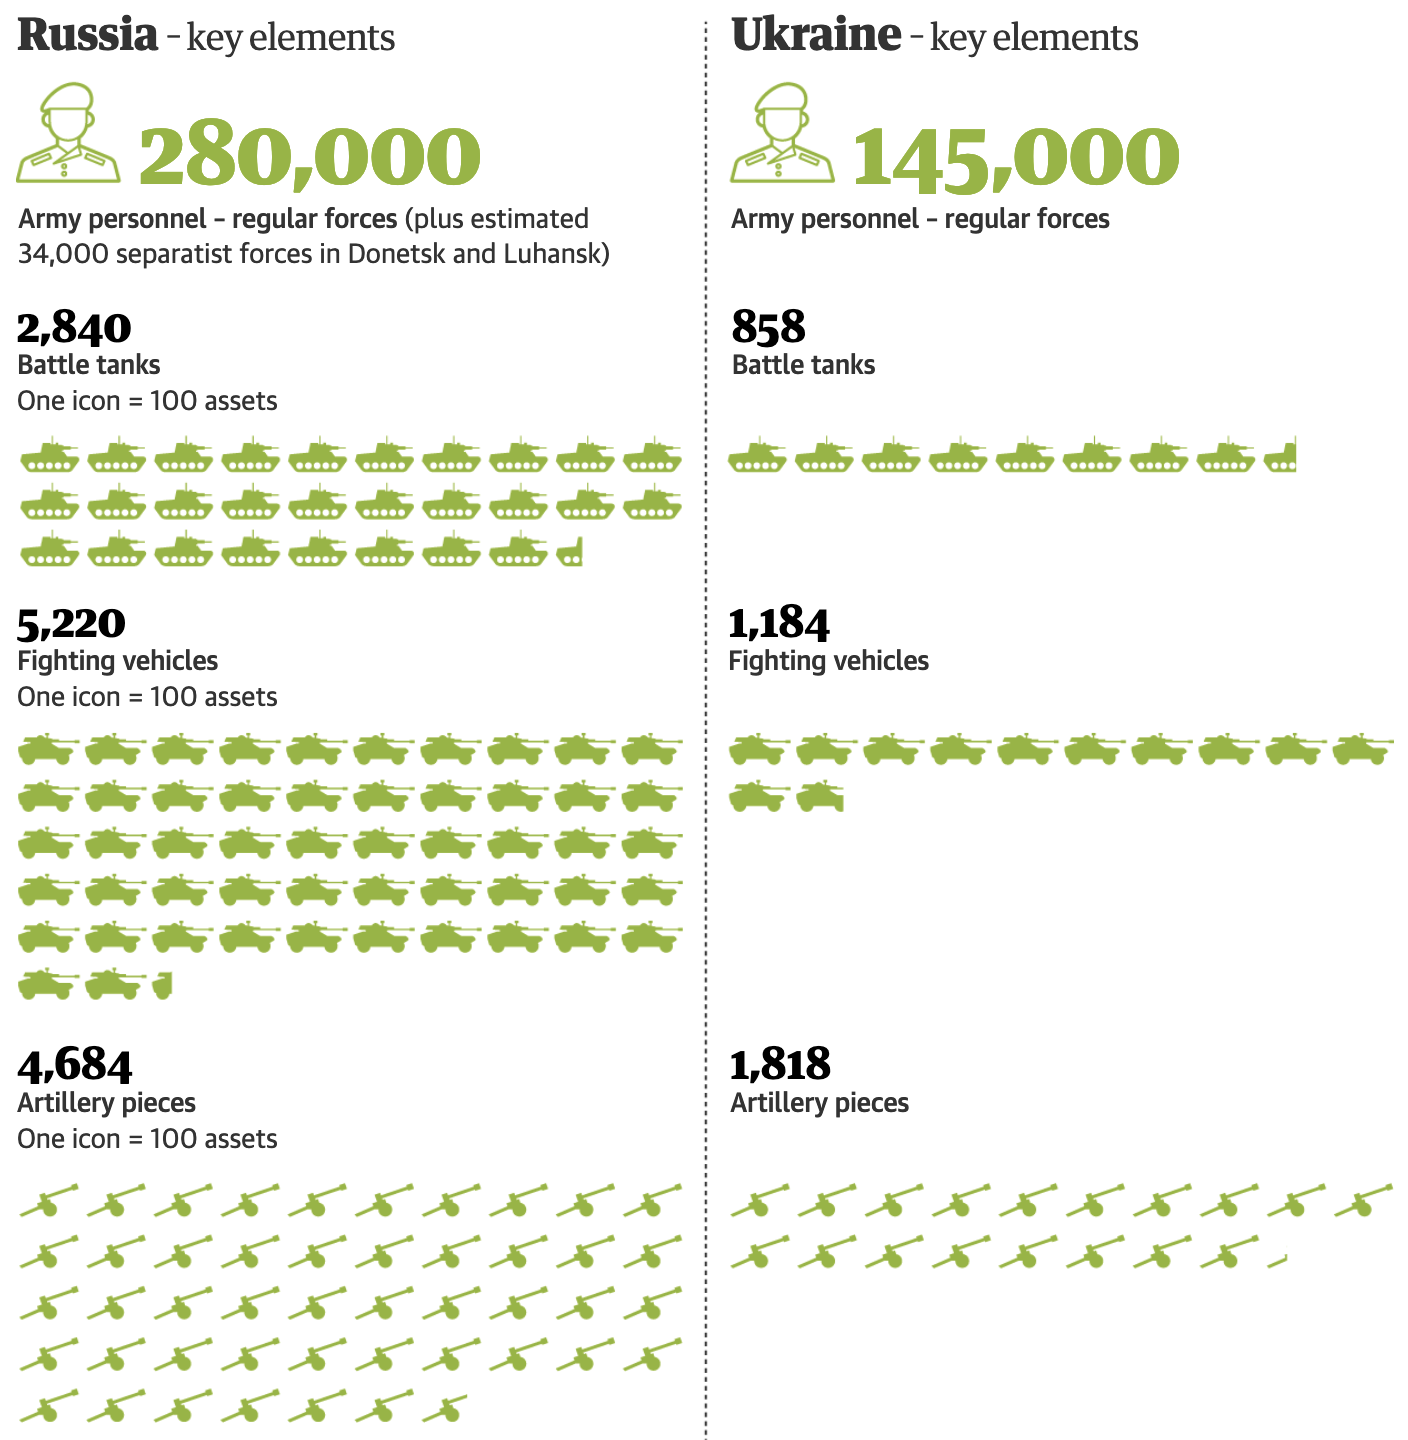
Source: Russia’s war in Ukraine: complete guide in maps, video and pictures, theguardian.com
A common pattern when small details are important in a data driven story, is to start with a general, high level overview on the data to give context, and then zoom in on smaller details. This technique of zooming in can be applied both in static and interactive media.
Below is an example using a “lens” to magnify a small but significant detail in the visualisation.
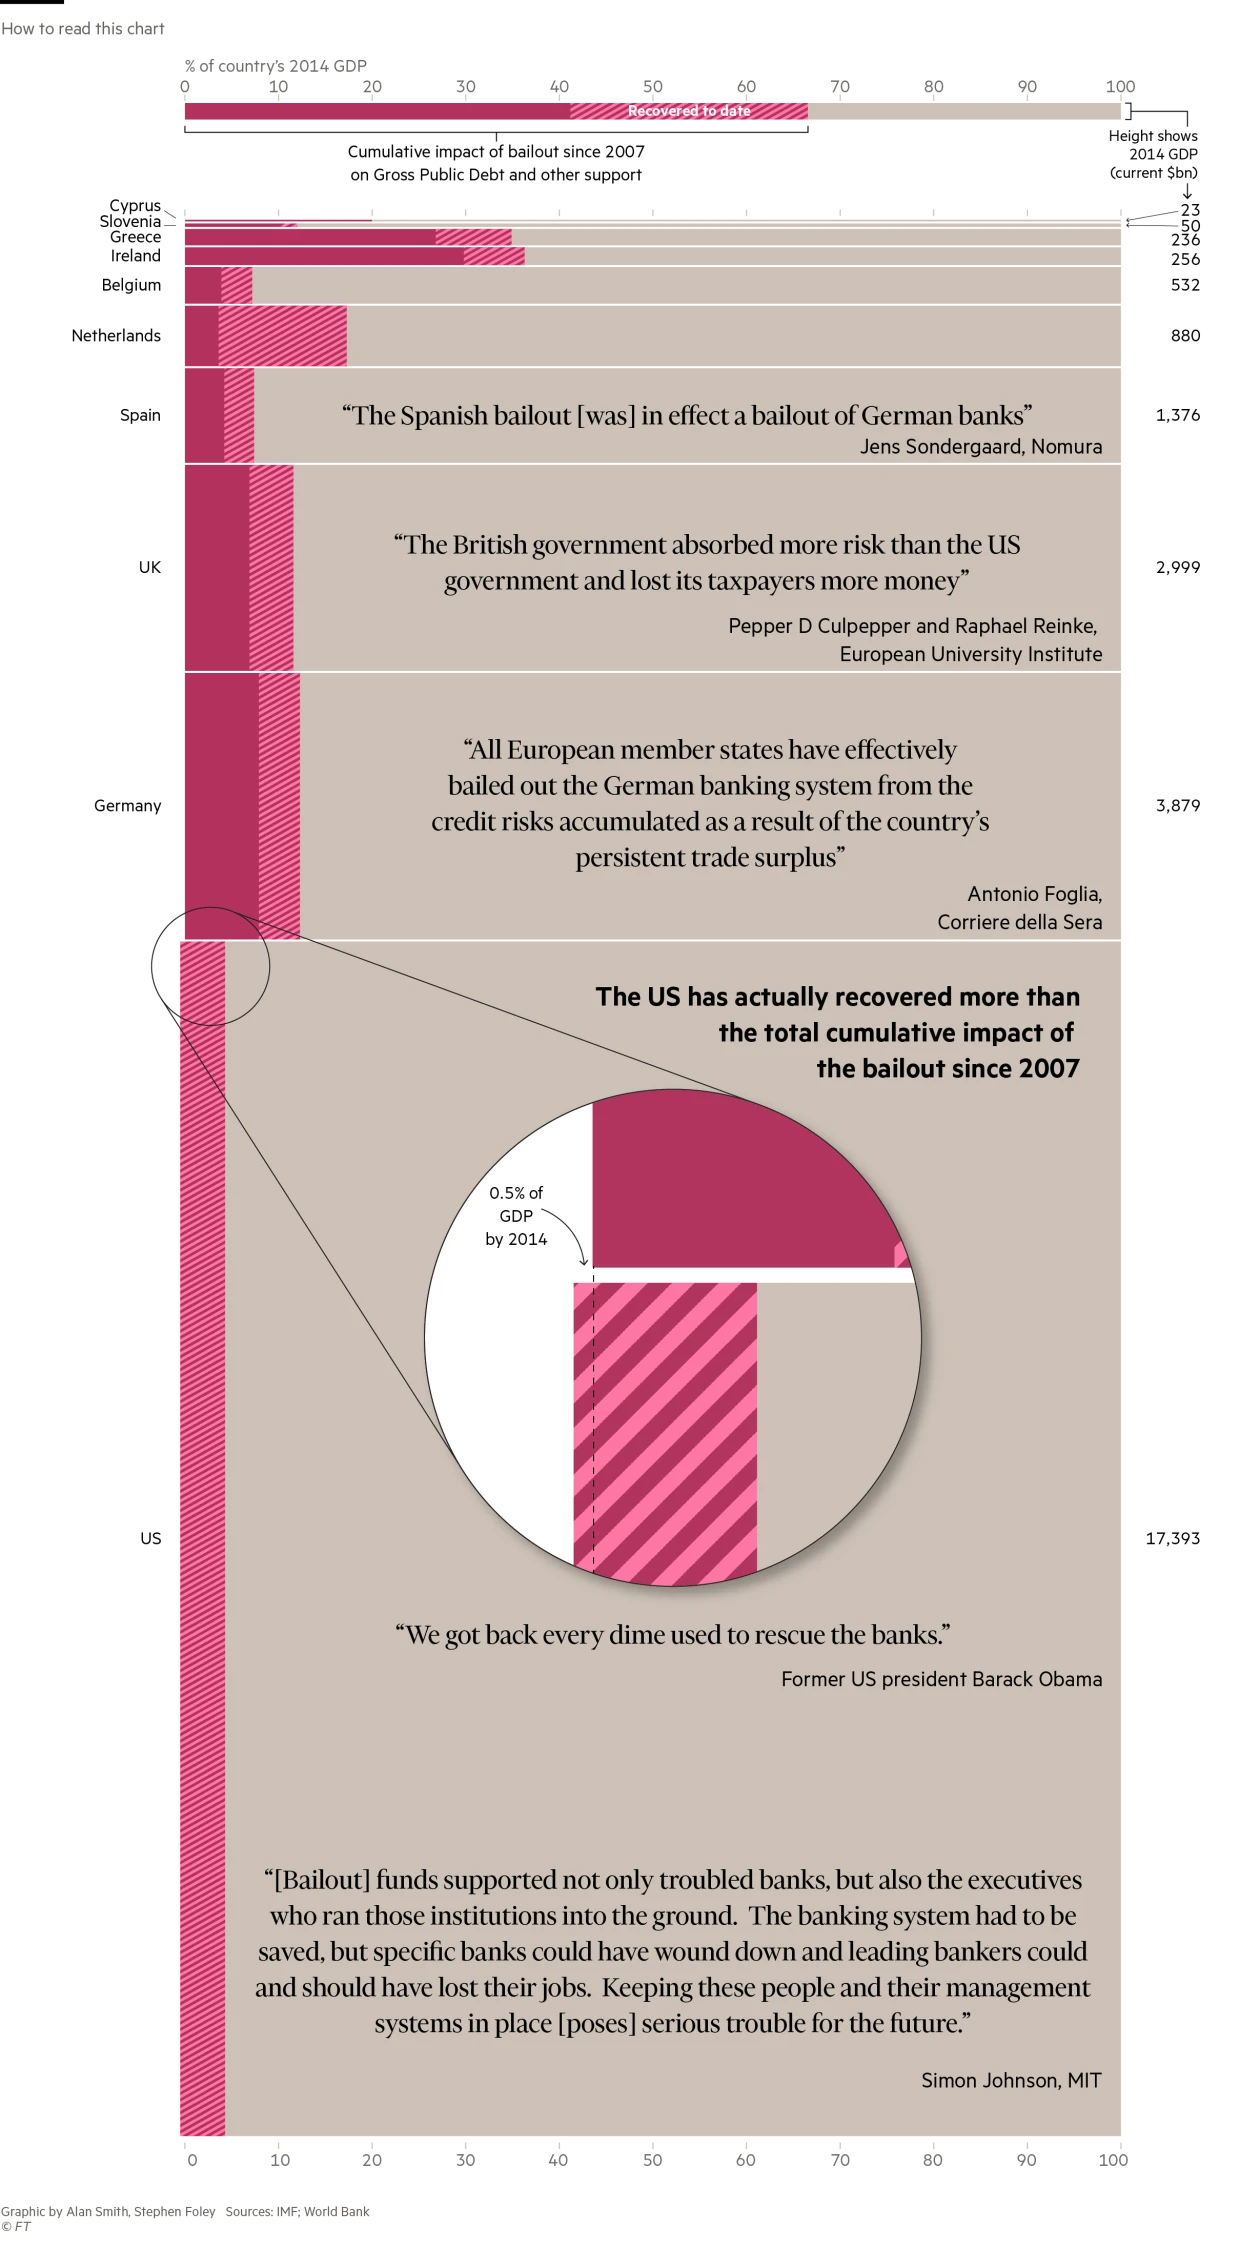
Source: FT.com
In the pie charts below, a small portion of the top 2 charts is magnified in the pie chart just below it.
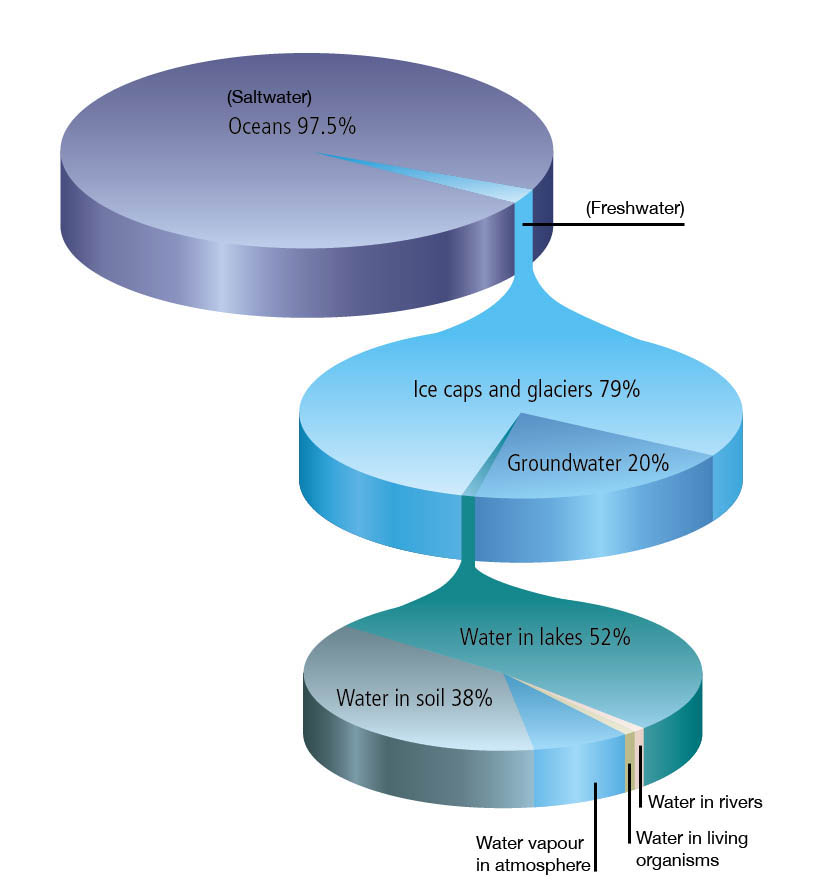
Source: thiswoo.wordpress.com, graphic by Andrew Davies
Zooming in does not have to involve very elaborate designs. Below the same data as above is used, but this time with more traditional chart types.
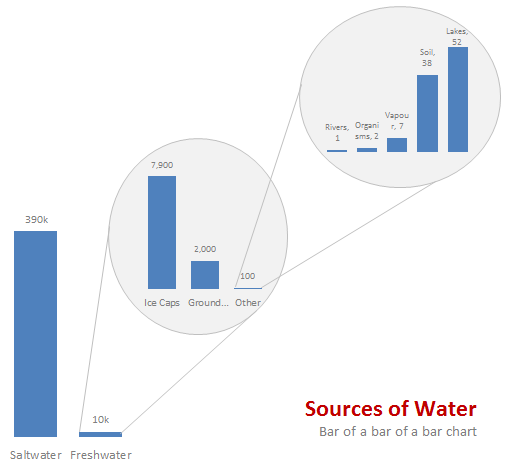
Source: Chandoo.org
The reverse of zooming in can also work well: start with a detail and then zoom out to show the bigger picture. The video midway Living in China’s Expanding Deserts transitions the story of a little boy and his family living in a Chinese desert to a map of China showing the issue of desertification in the country.
The same dataset can be visualised in many different ways. And sometimes a data driven story can benefit from having multiple views on the same data, to switch the context and to have a look at the data from a different angle. A map can show geographical patterns in data, but a different representation of the entities on the map can show other patterns, like ranges and distributions. In online media, a context switch can be animated so that it is more obvious that data in the 2 different visualisations is actually the same.
A map transitions into a dot plot. Source: Why Budapest, Warsaw, and Lithuania split themselves in two, pudding.cool
A last specific view pattern are small multiples. When a multi-series visualisation contains many series (like a line chart with many lines) and the series are of equal importance, the visualisation can become crowded quickly. Small multiples help to overcome this problem by showing repeated mini versions of the chart for each series, which can then be arranged next to or above and below each other. Applying a logical ordering to the small multiples helps to compare them, and helps to quickly find a small multiple of interest.
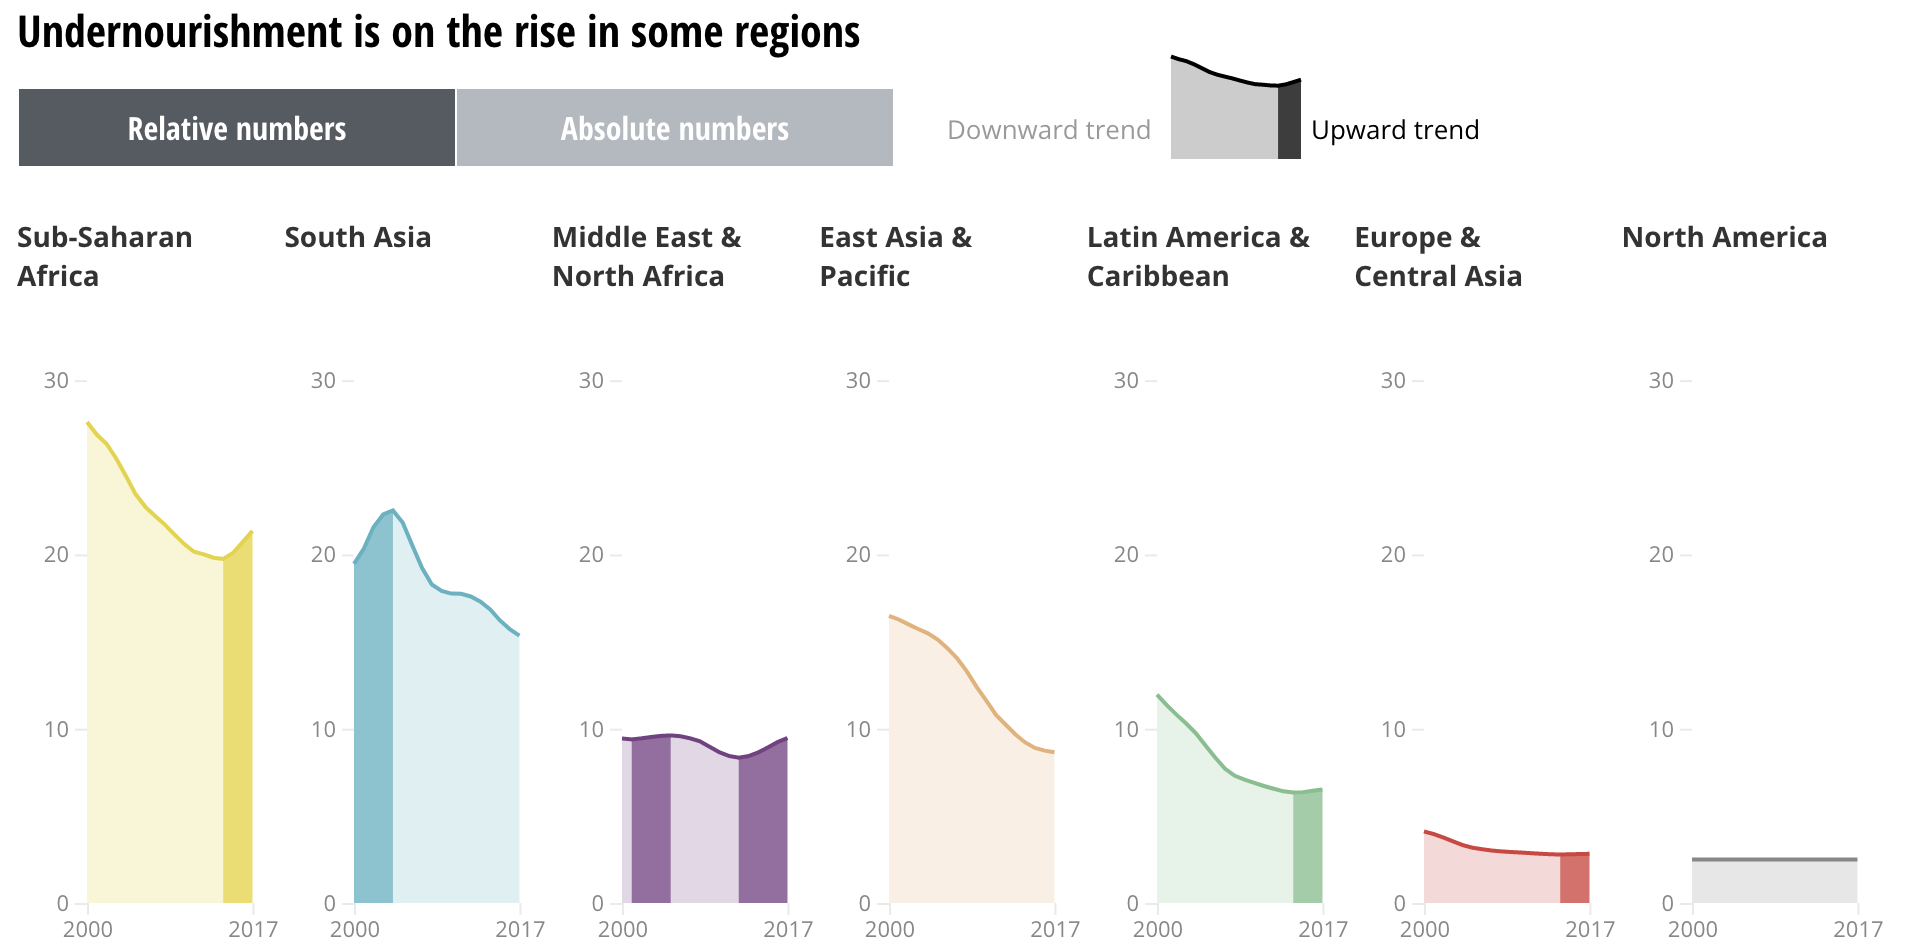
Source: Beyond hunger: ensuring food security for all, Sustainable Development Goals Atlas 2020, World Bank
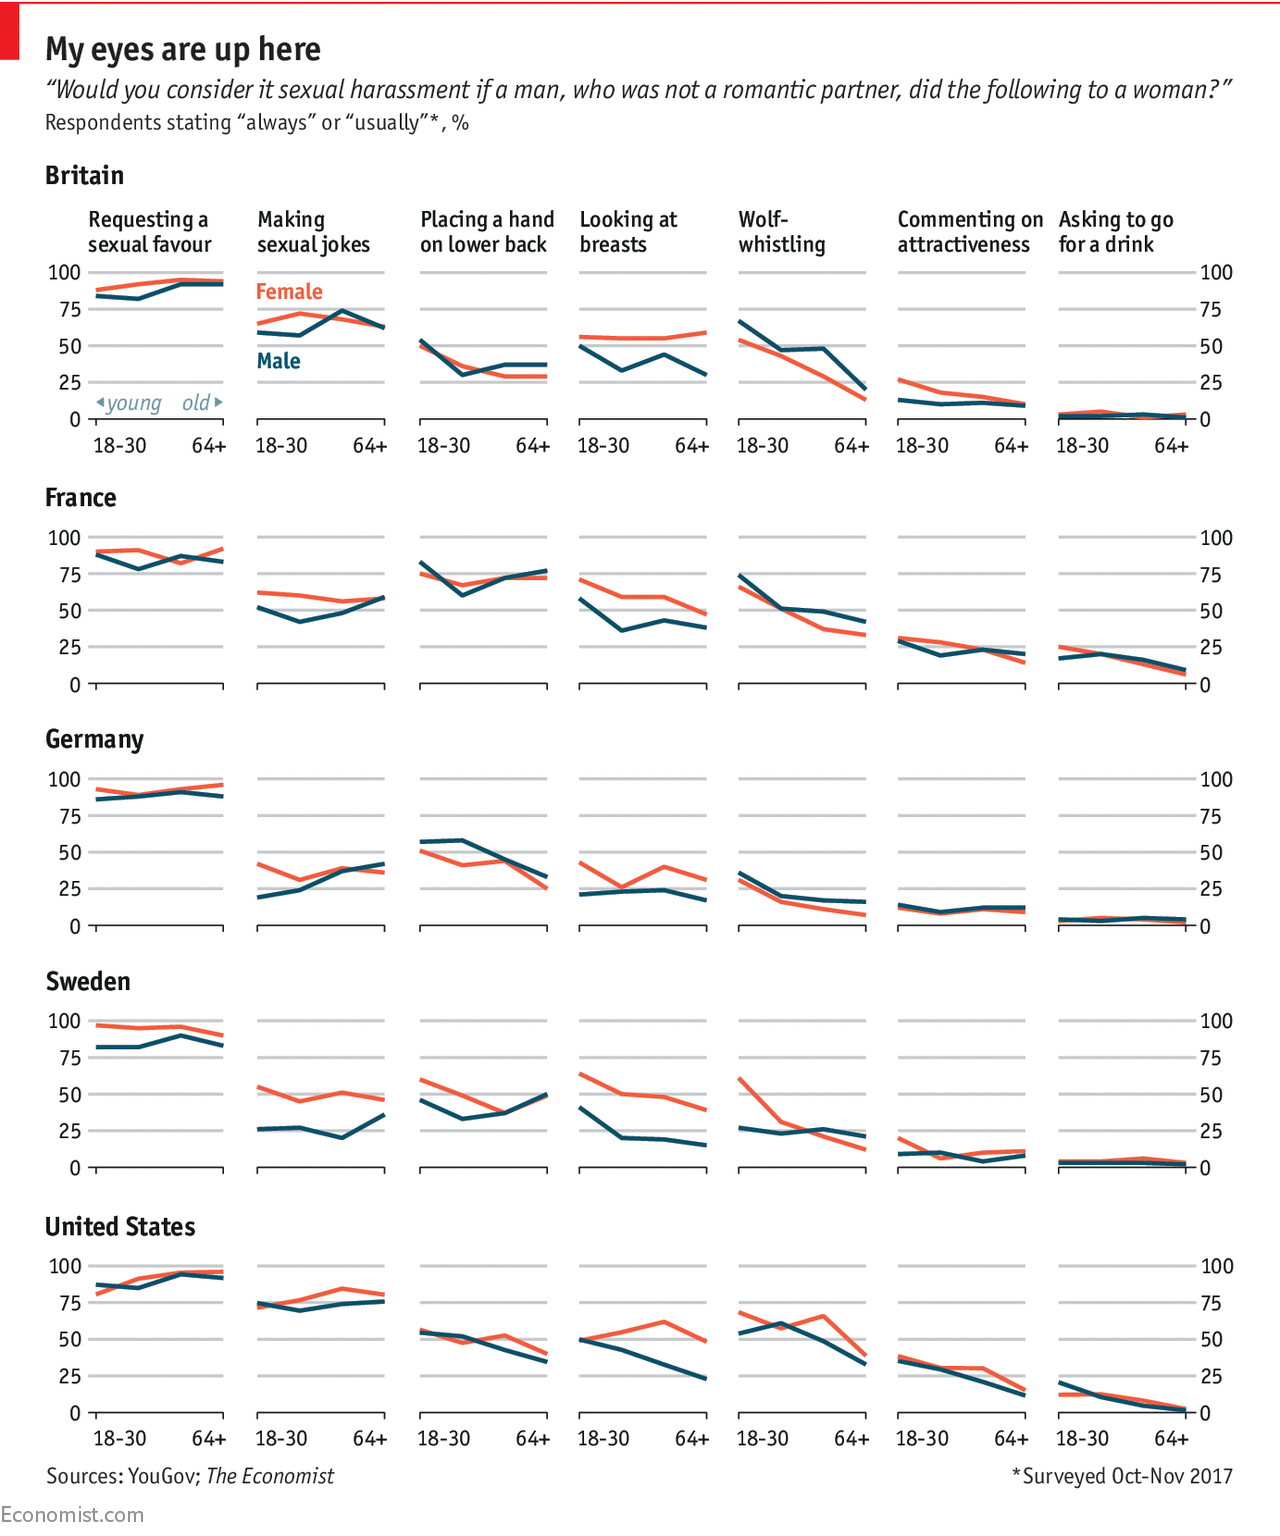
Source: Over-friendly, or sexual harassment? It depends partly on whom you ask, Economist.com
A view pattern specifically designed to grab attention is to break existing conventions in data visualisation. This make people look twice and it generate curiosity. But because breaking conventions comes at a cost (in legibility and efficiency in communicating data) this technique might lead to confusion.
A classic example of this is Iraq’s bloody toll by Simon Scarr. It breaks the convention of the y axis running from bottom to top, in order to mimic blood dripping down the chart.
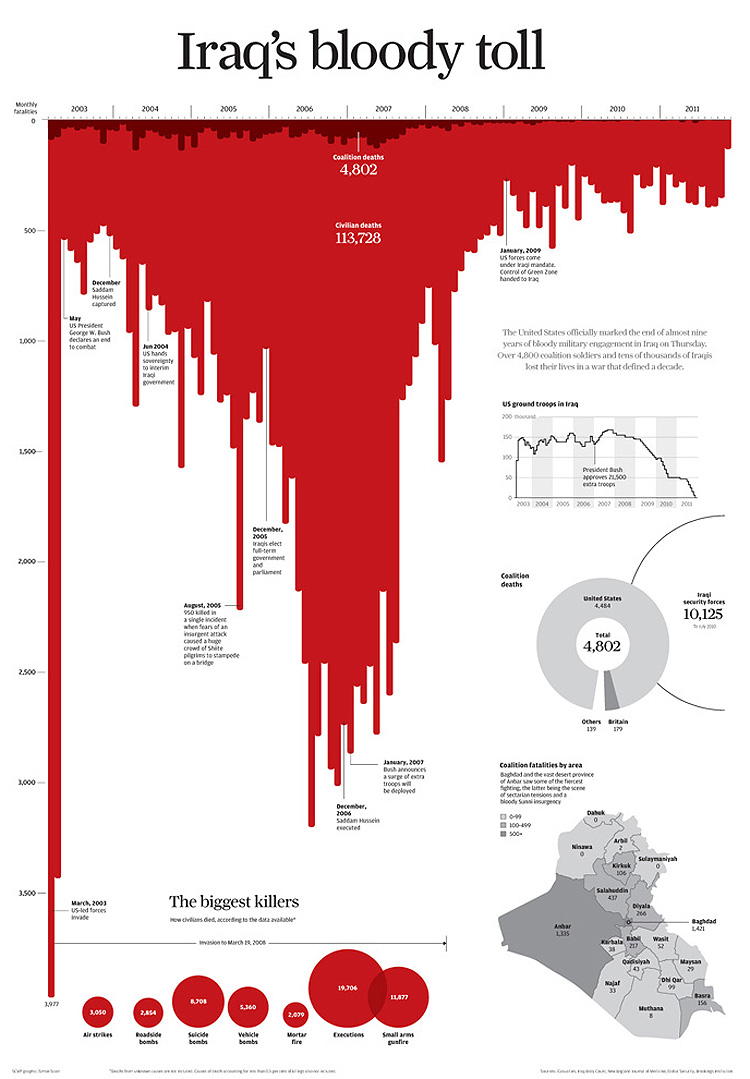
Source: simonscarr.com, for South China Morning Post
Letting the x axis spiral instead of letting it run straight, is a very clear example of breaking a convention. This spiral chart showing new covid-19 cases in the US sparked a lively debate over its design (people arguing against the spiral chart forgot or didn’t know that it accompanied an opinion article, and was not designed as a visualisation to read exact values from).
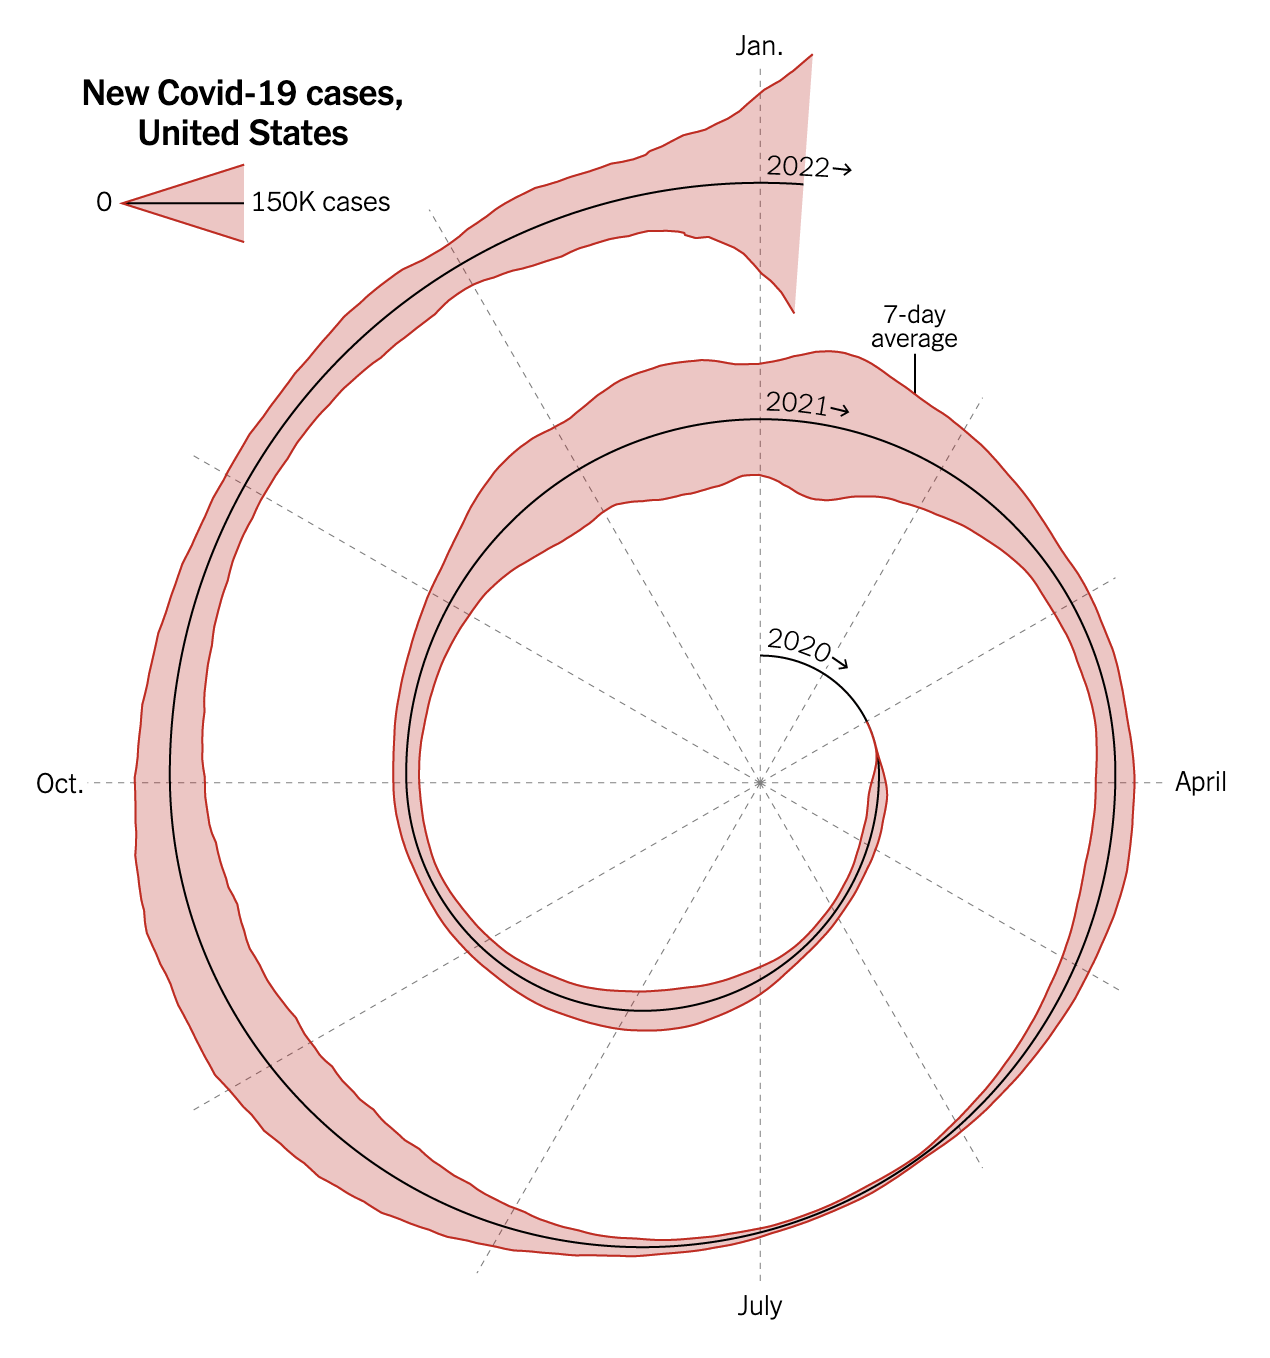
Source: Here’s When We Expect Omicron to Peak, nytimes.com
An illustration of how strong conventions are and how strange things can look when they are not respected, is this rotated map of the Mediterannean. We are so used to seeing maps with the North up that this North-to-the-right map feels strange. Suddenly Europe seems much closer to Africa than we think it is.
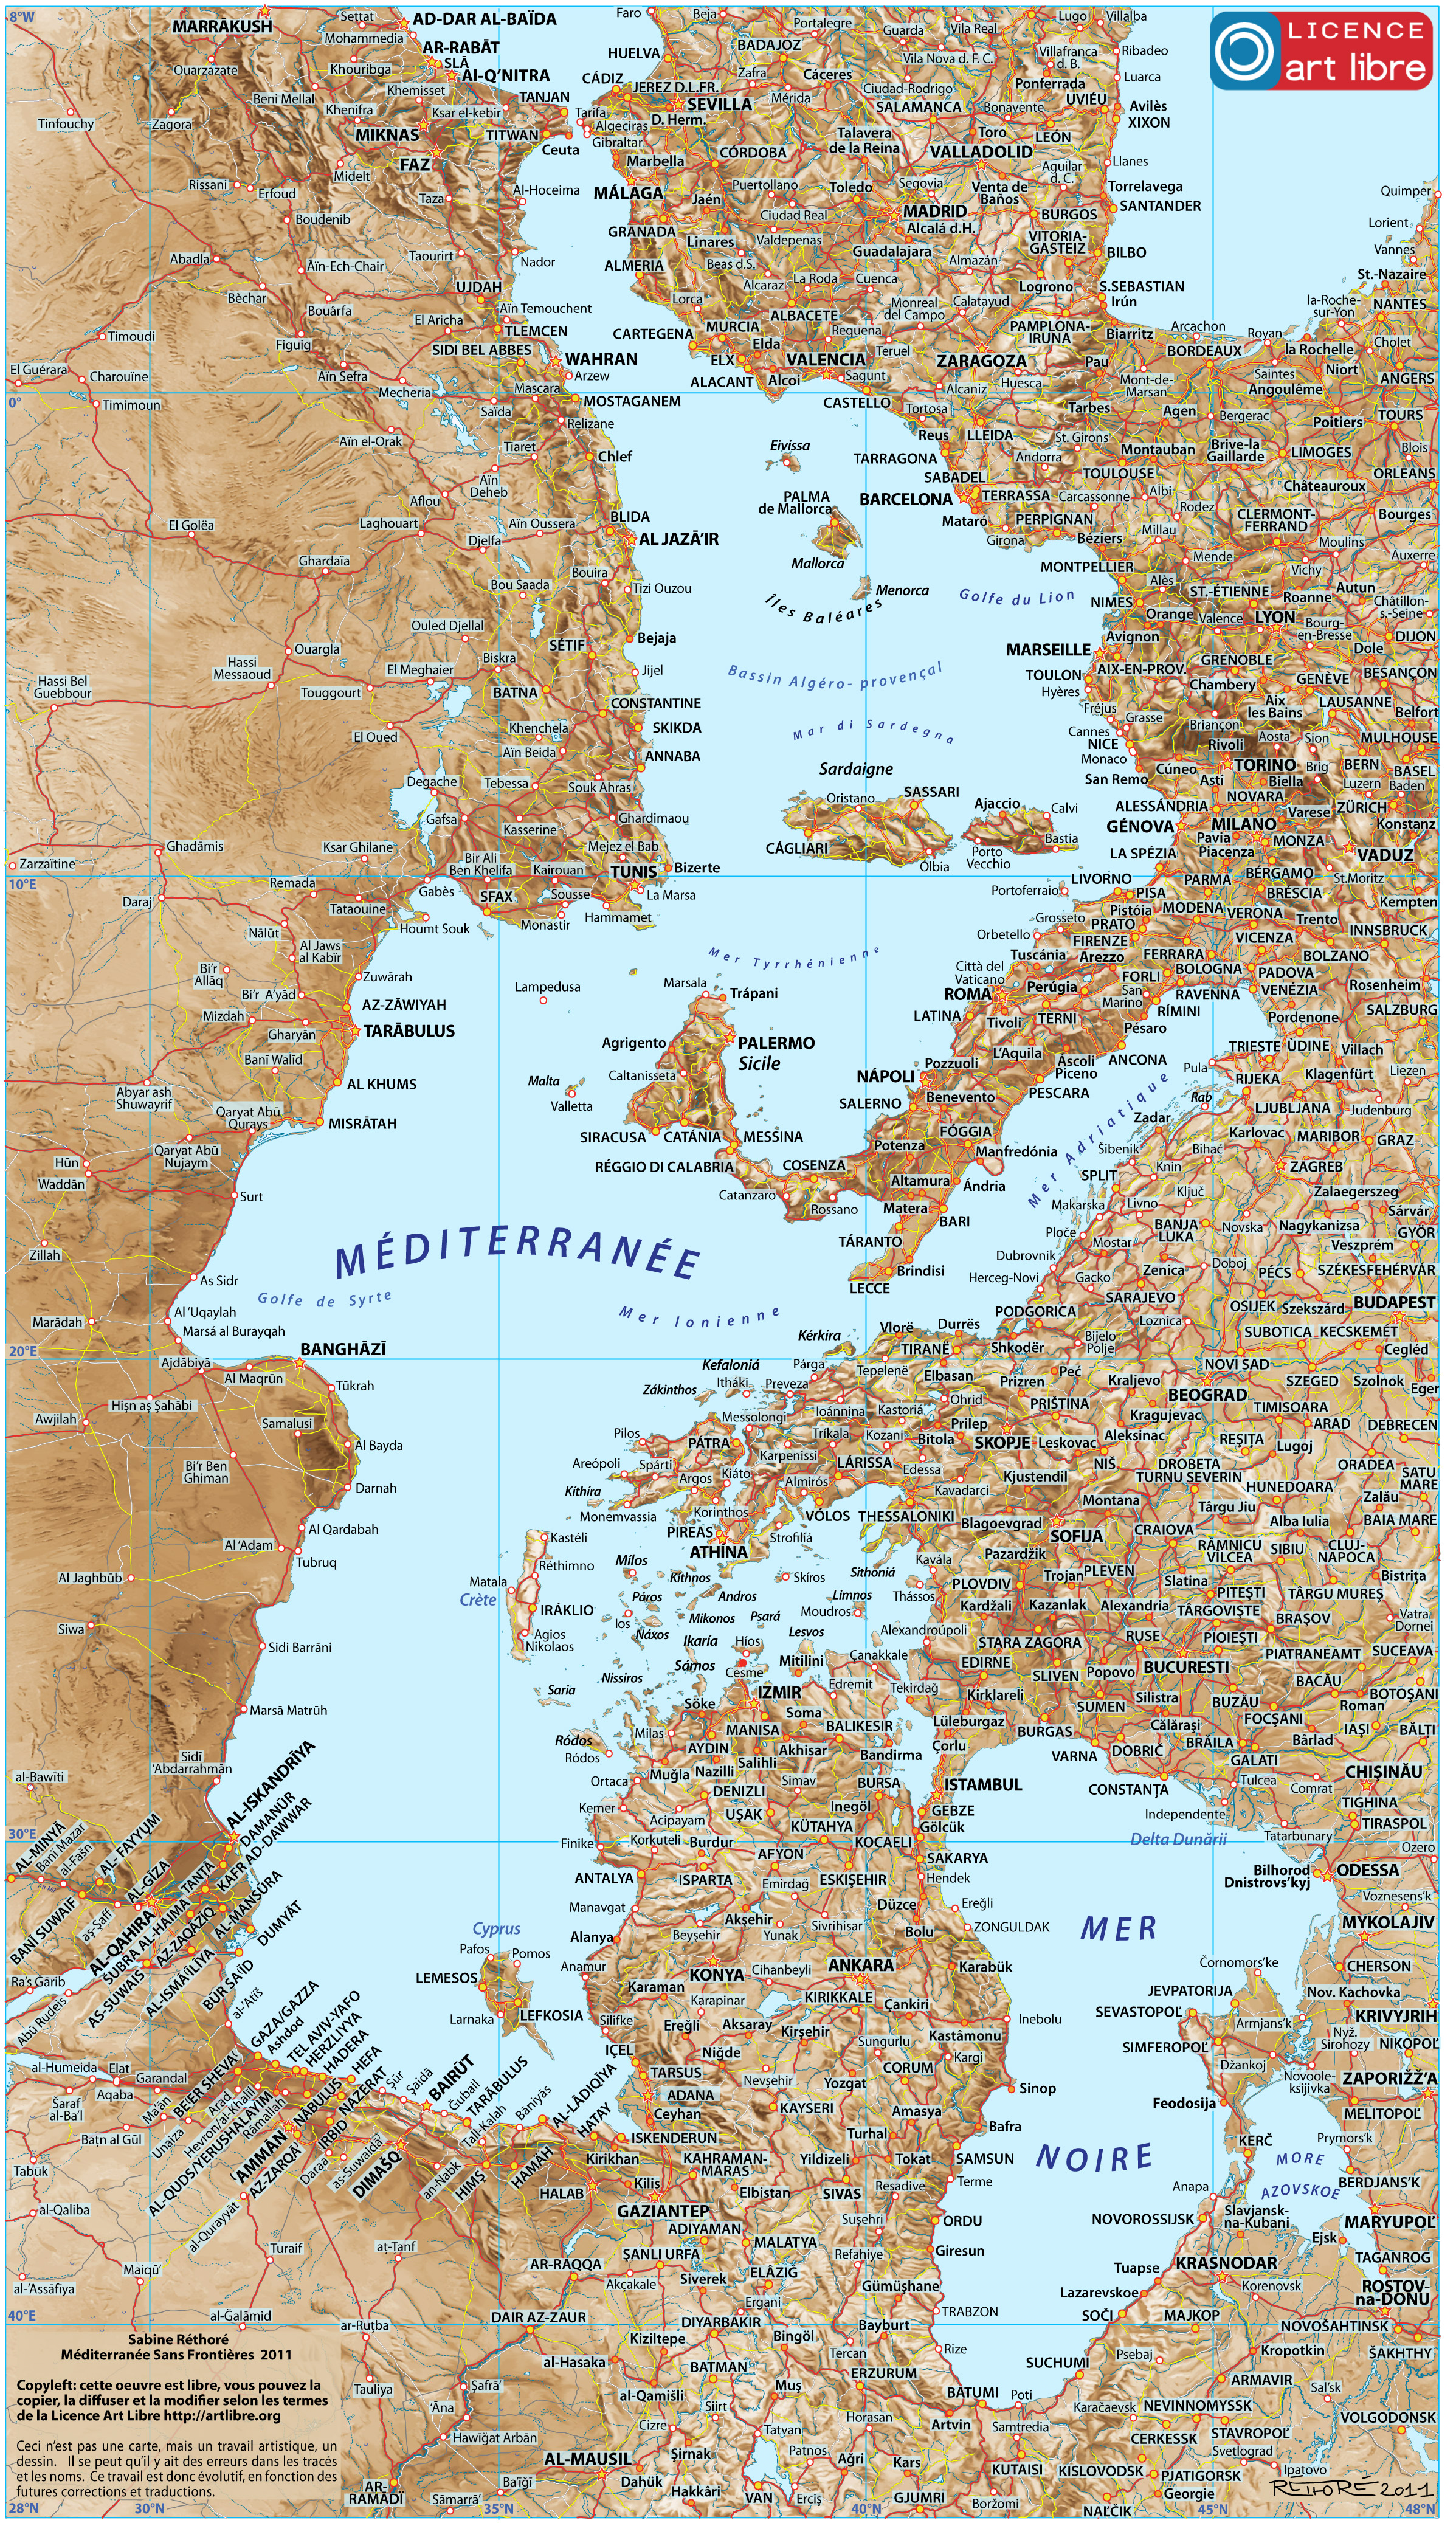
Source: Sabine Réthoré, Free Art License