Free, open source
observablehq.com/@observablehq/plot
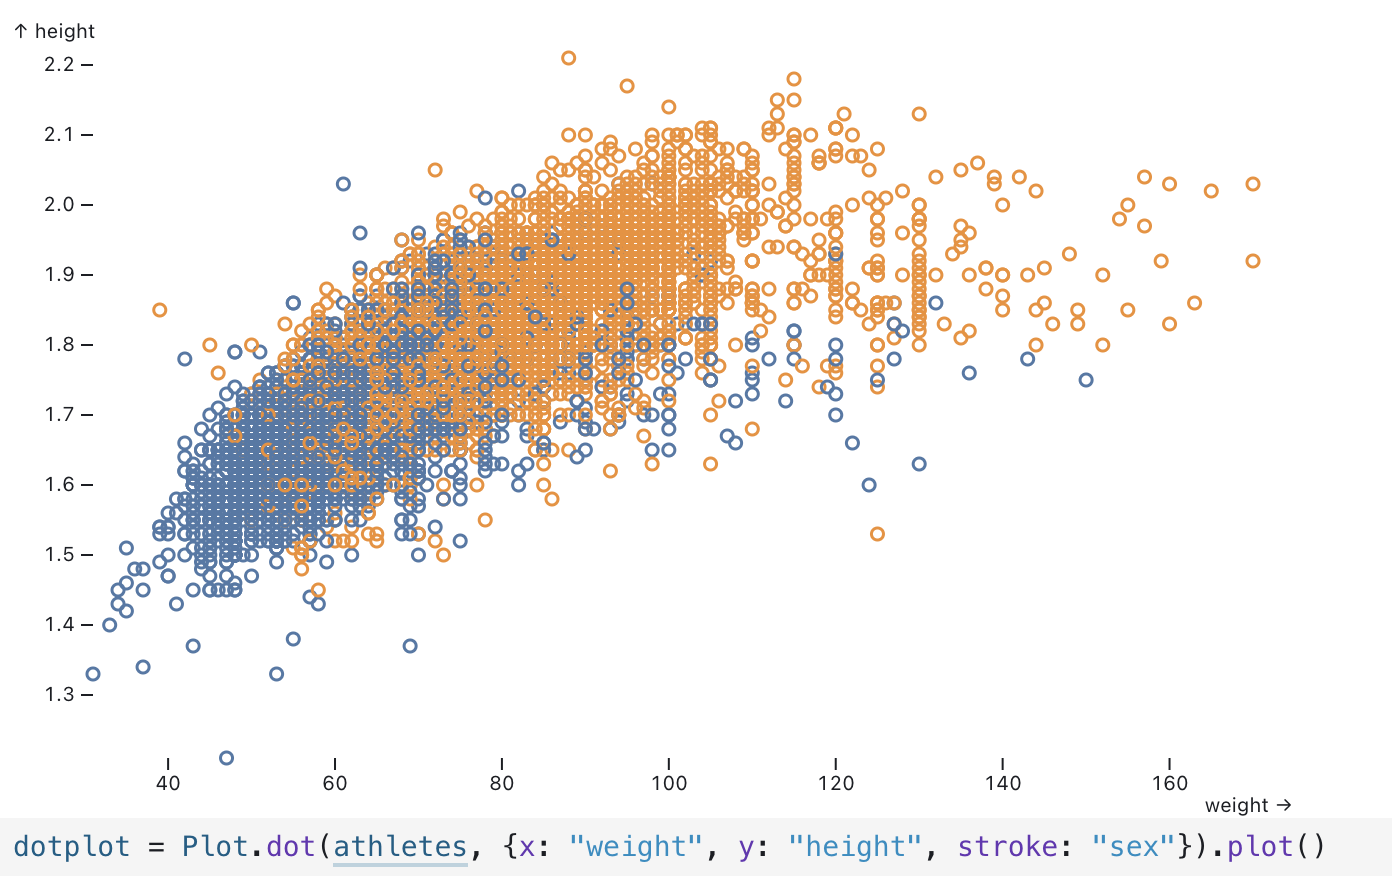
Observable Plot is a JavaScript visualisation library created by Mike Bostock, the creator of the D3 library. It is based on the same concepts as Vega, and generates charts in SVG. It was developed to work well in the Observable interactive notebook environment, but is also available as a standalone JavaScript library.
Source: observablehq.com/@observablehq/plot
See Grammar of Graphics in practice: Observable Plot for an introduction to Observable Plot.