Free, open source
Vega and its smaller and simpler sister Vega-Lite are languages to specify how a visualisation is composed from data. It uses the same foundations as ggplot2 in R and Altair in Python, so it specifies how columns in the data should relate to properties of graphical marks, like points or bars. On top of that, it can also describe interactive features of visualisations.
{
"$schema": "https://vega.github.io/schema/vega-lite/v5.json",
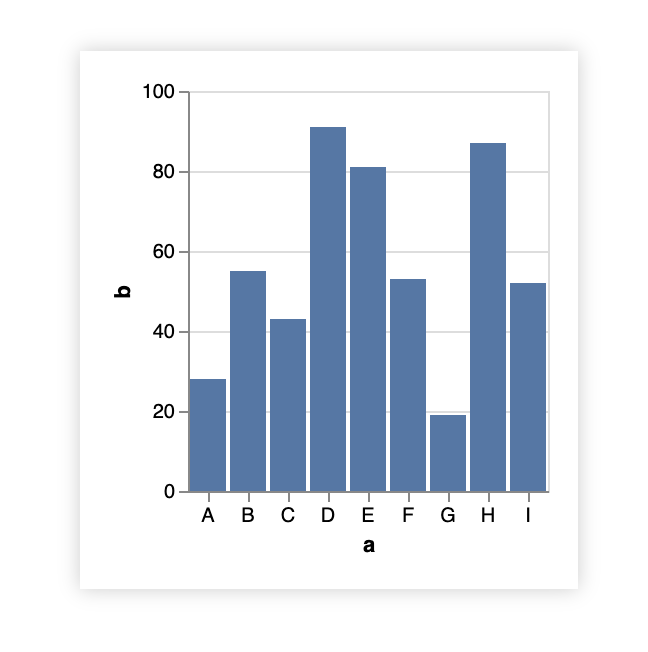
"description": "A simple bar chart with embedded data.",
"data": {
"values": [
{"a": "A", "b": 28}, {"a": "B", "b": 55}, {"a": "C", "b": 43},
{"a": "D", "b": 91}, {"a": "E", "b": 81}, {"a": "F", "b": 53},
{"a": "G", "b": 19}, {"a": "H", "b": 87}, {"a": "I", "b": 52}
]
},
"mark": "bar",
"encoding": {
"x": {"field": "a", "type": "nominal", "axis": {"labelAngle": 0}},
"y": {"field": "b", "type": "quantitative"}
}
}
Source: vega.github.io/editor
Vega and Vega Lite are written in JSON and on their own, they are not enough to turn data into a visualisation. The creators of Vega developed another library to embed visualisations based on Vega into web pages, called Vega Embed.
See Grammar of Graphics in practice: Vega-Lite for an introduction to Vega-Lite.