Managing a collection of styled templates is a good way of ensuring a consistent styling for your visualisations. But this requires some work: the templates need to be created, and making changes to your visualisation style requires updating all templates.
That is why some tools take a different approach. Instead of having a styled template for each chart type, these tools use a theming system that can be applied to any chart you make with the tool. The theming system is independent from the chart type, and because of this, the styling only needs to be managed in the theme.
A tool using this approach is Datawrapper. In the Layout tab, you can select a theme with a dropdown menu.
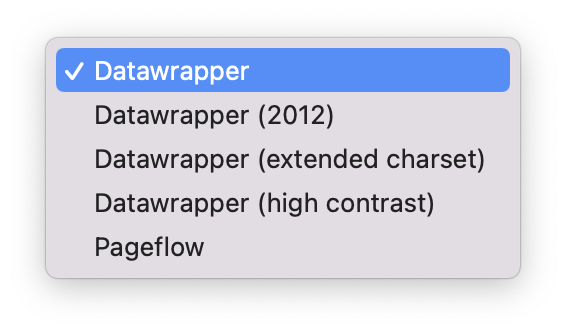
Available themes in Datawrapper free accounts. Source: Maarten Lambrechts, CC BY SA 4.0
Datawrapper offers custom themes, with custom fonts, colours and logos, but only for paying plans.
A free and open source tool that is also using a theming system is the ggplot2 package of the R programming language. The package has some built in themes, and additional packages provide more themes.
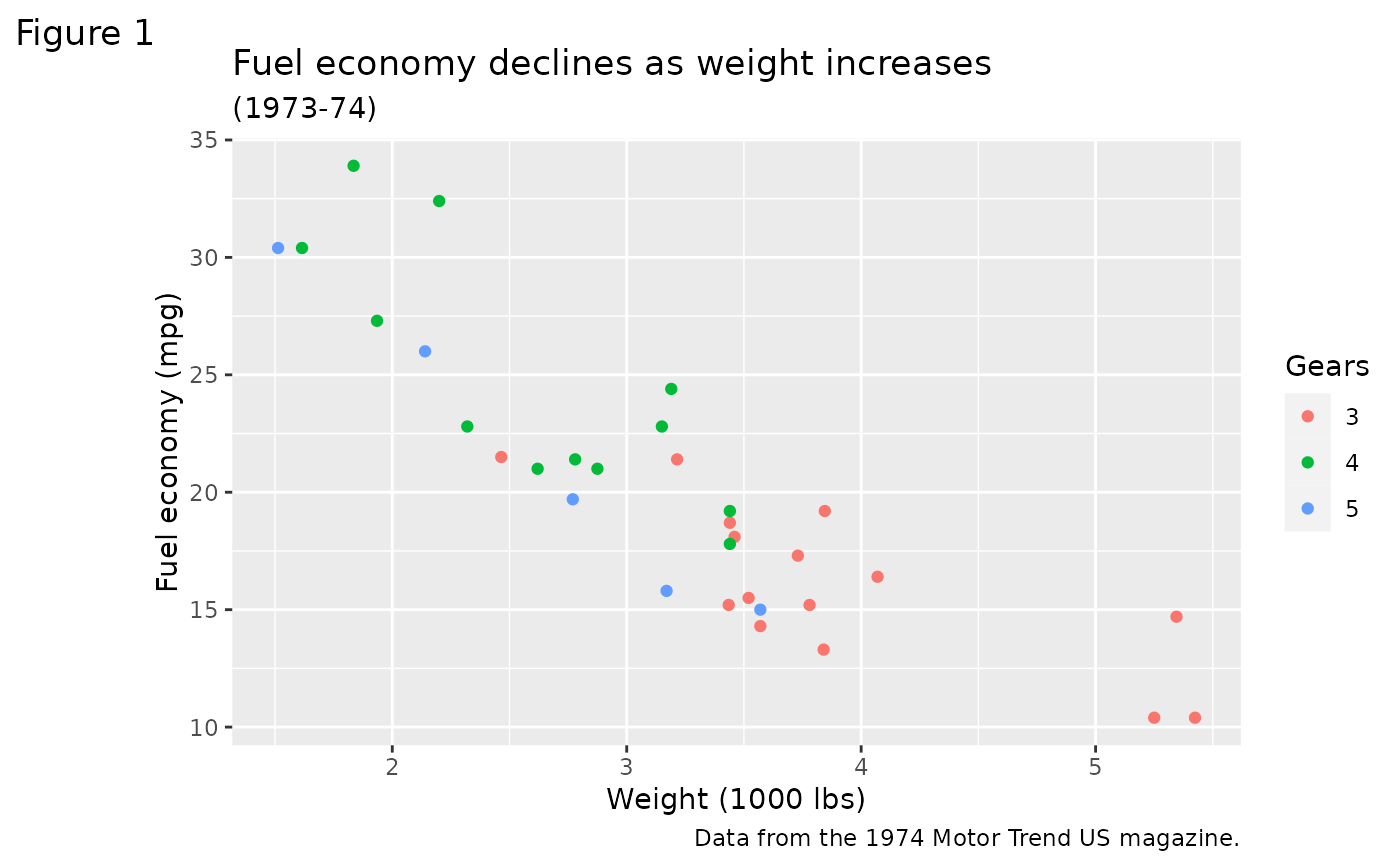
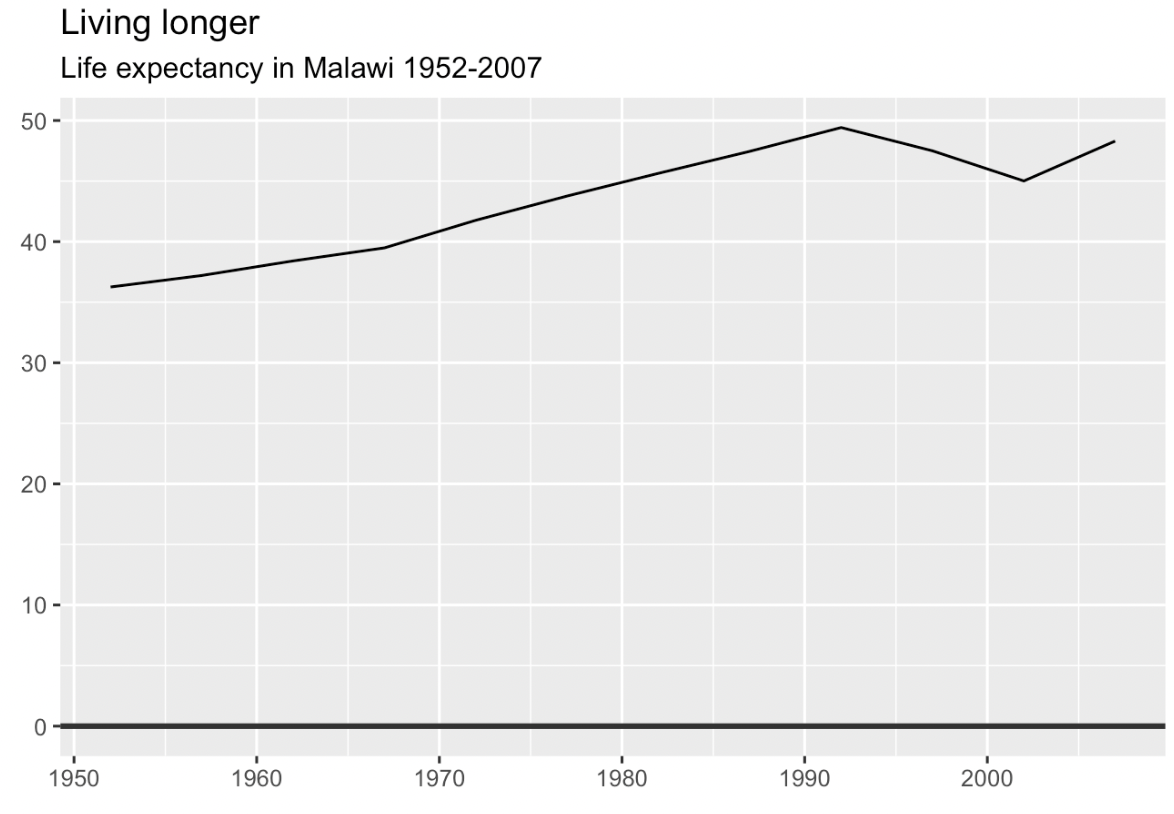
The default ggplot2 theme. Source: ggplot2 reference
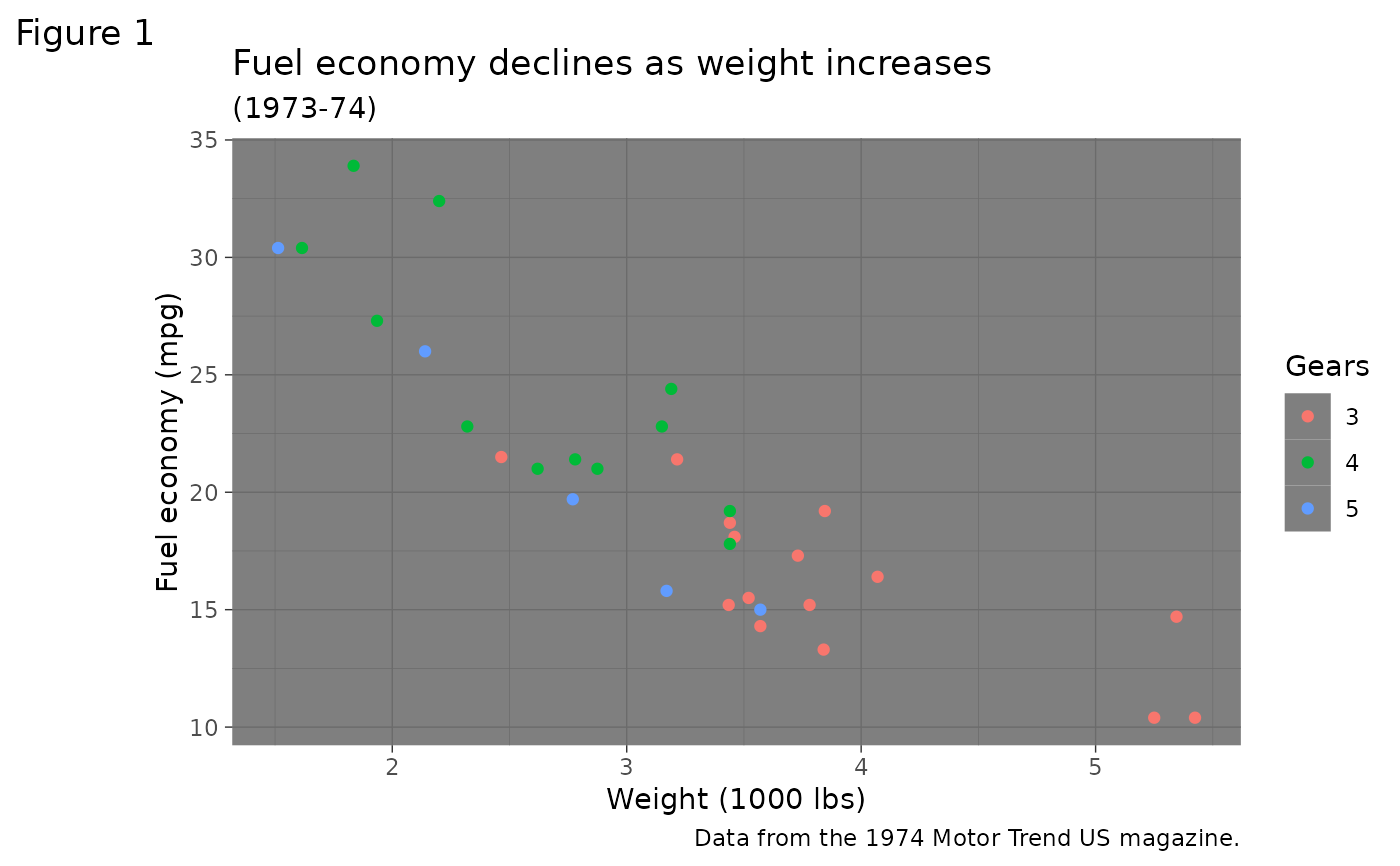
theme_dark. Source: ggplot2 reference
theme_bw. Source: ggplot2 reference
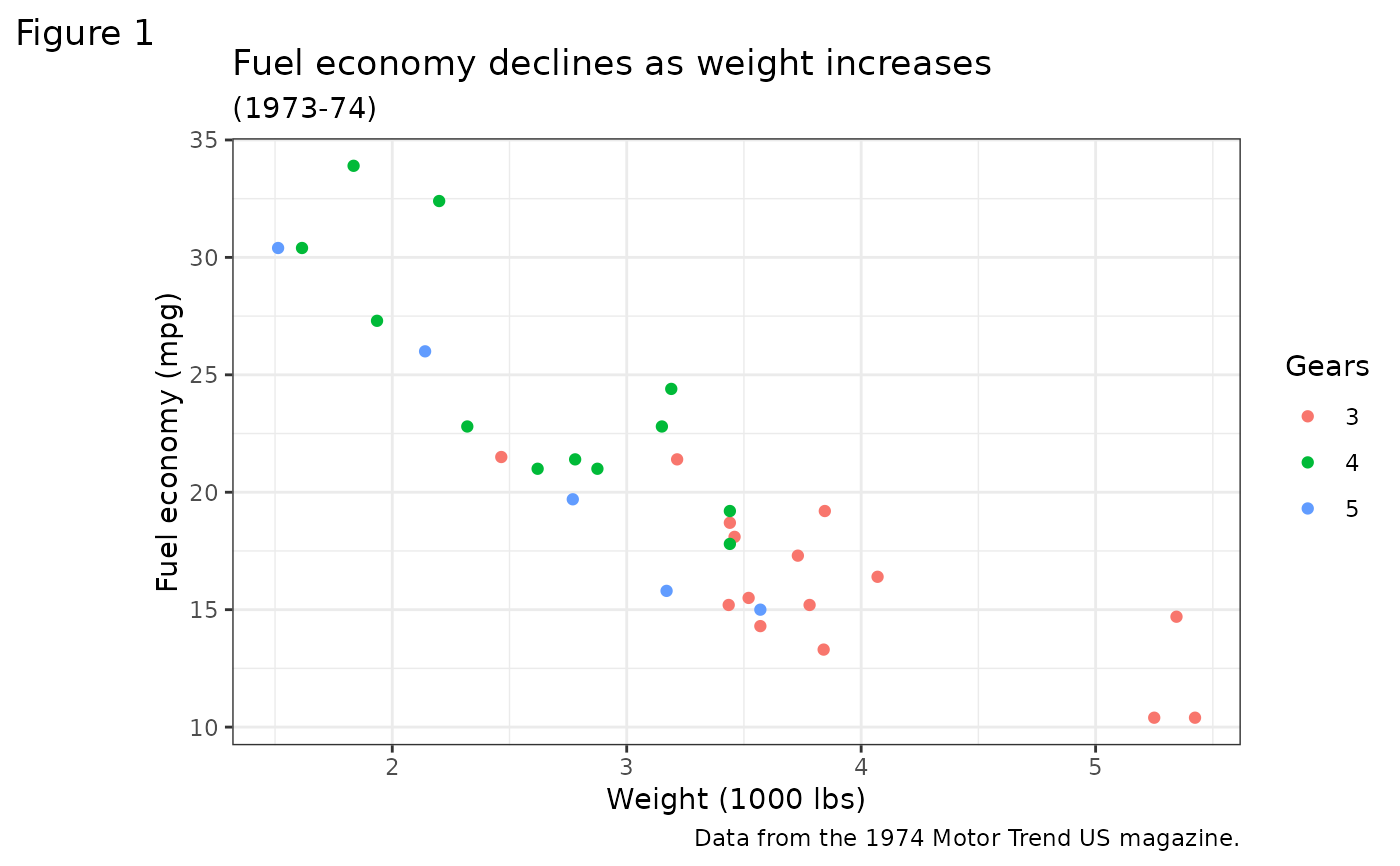
theme_minimal. Source: ggplot2.tidyverse.org/reference/ggtheme.html
Changing the theme of ggplot visualisation is as easy as adding one line to the code of your visualisation. If needed, the theming of specific elements on the chart can be overridden, and if you want you can develop a full theme to style your and your organisations charts.
The BBC produces many of its charts with R and ggplot2. In order to maintain a consistent styling and to save time on styling charts, it developed its own theme to create publication-ready graphics in their in-house styling.
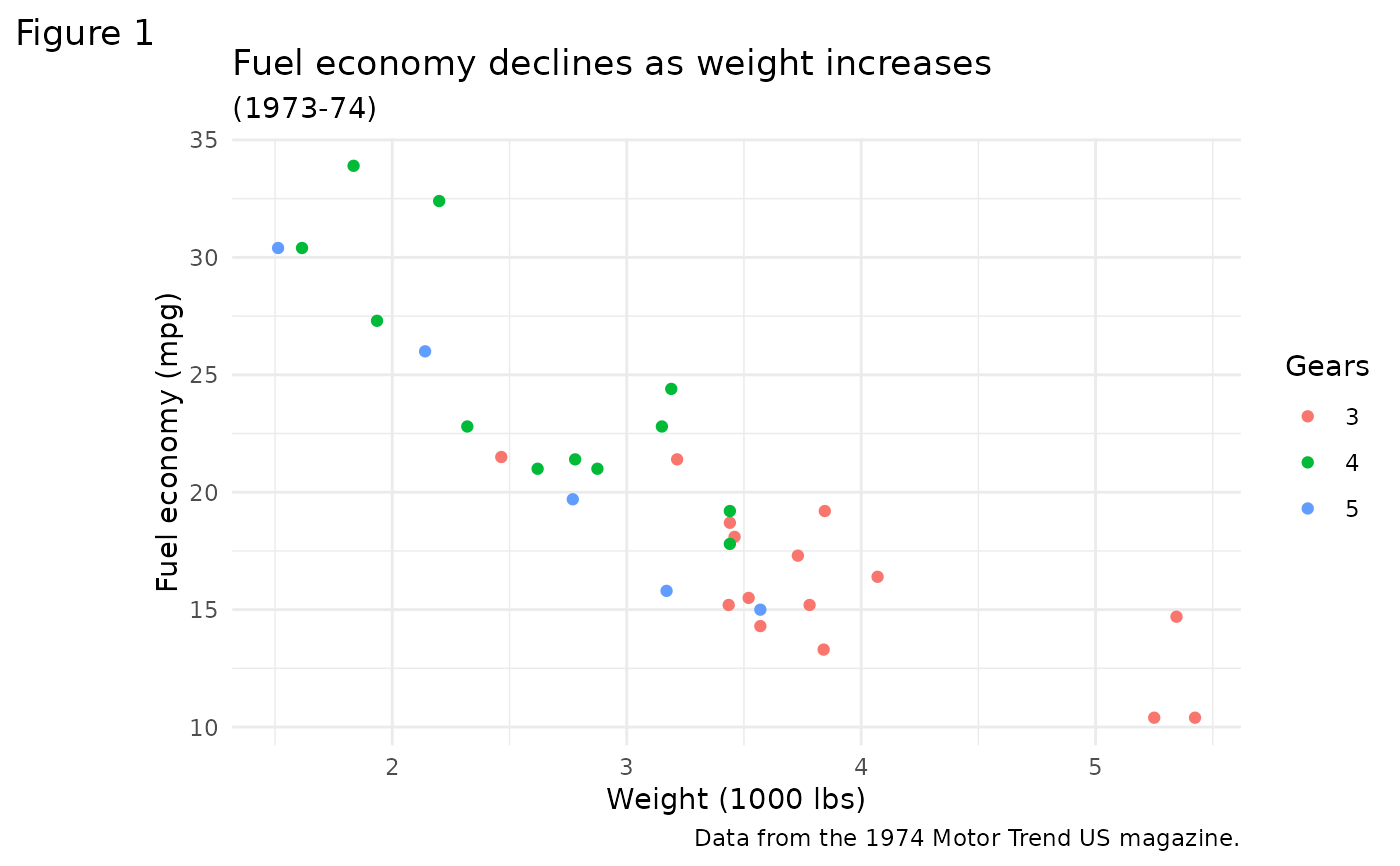
A chart using the default ggplot2 theme. Source: Maarten Lambrechts, CC BY SA 4.0
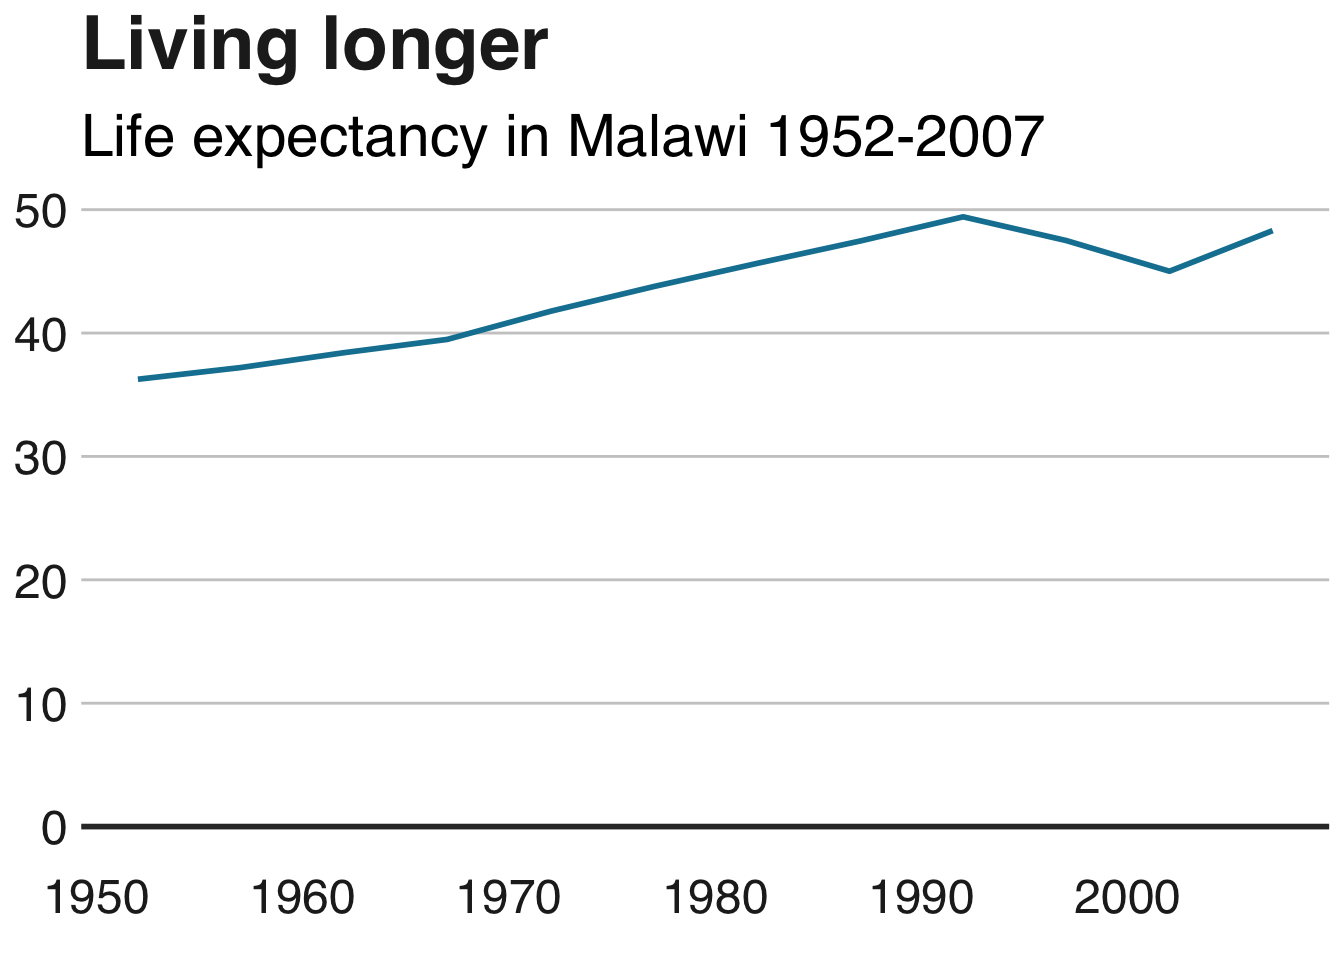
The same chart styled with the BBC ggplot2 theme. Source: Maarten Lambrechts, CC BY SA 4.0