High-value datasets – mobility in the EU
Monitoring the push towards greener mobility in the EU
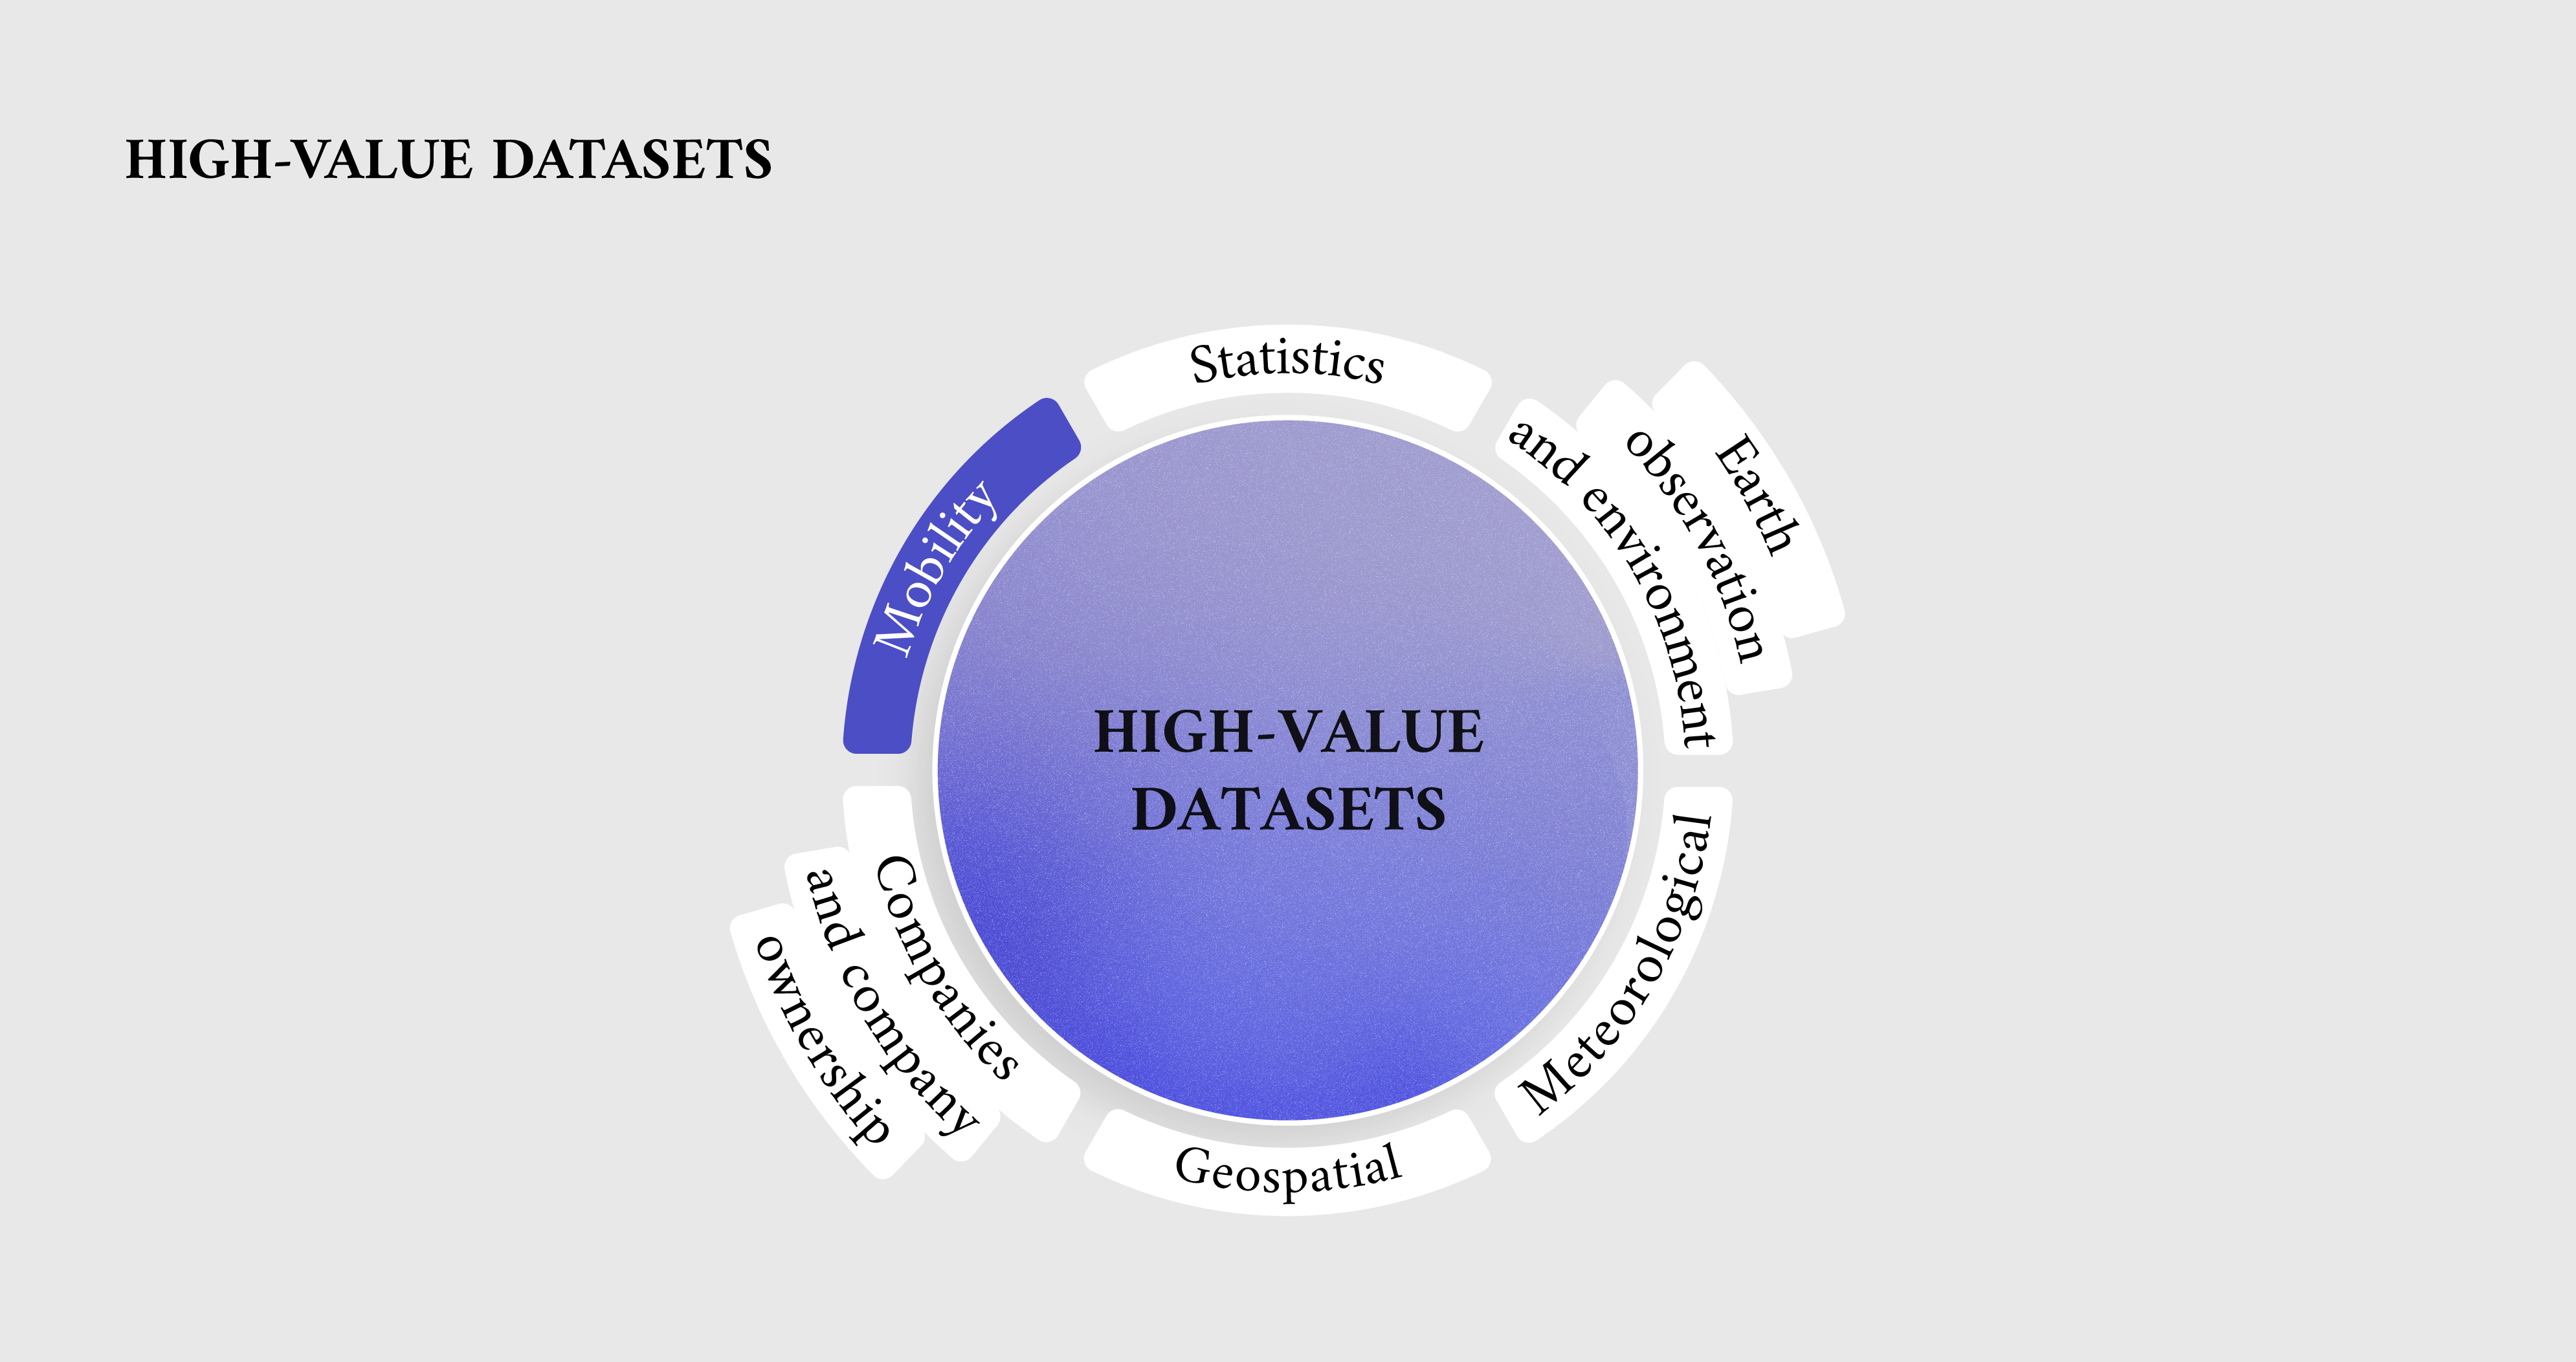
This is part of a series of articles showcasing examples of high-value datasets from their different thematic categories. High-value datasets are defined by EU law based on their potential to provide essential benefits to society, the environment and the economy. This series aims to help readers find reliable and accurate information from official sources relating to the availability of various high-value datasets, and to present this information through data visualisation. You can check out the article providing an overview of high-value datasets.
Only datasets specifically defined by law can be considered high-value datasets, and as such the data presented in this series of articles does not necessarily fall under that definition. Instead, the data has been chosen to be thematically adjacent to high-value datasets and to showcase what can be done with information made available by official EU bodies and EU Member States. The official list of high-value datasets adopted on 12 December 2022 can be found in the legal documents that define these datasets and their characteristics.
Mobility and high-value datasets
The drive towards a greener, more sustainable economy encompasses many aspects of society, including transportation. Modern, efficient transportation methods can significantly reduce individuals’ carbon footprint and contribute to the fight against climate change.
The European Commission has proposed several initiatives within the context of the European Green Deal to improve the EU transportation system. The proposals aim to increase connectivity by shifting passengers and freight to rail and inland waterways, support the implementation of charging stations and alternative fuelling infrastructure and incorporate new digital technologies to improve urban mobility. The trans-European transport network will serve as the overarching EU transportation network, connecting 424 major cities through a network of rail, waterways, shipping routes and roads, reducing travel times between cities.
High-value datasets will support the implementation of this strategy by improving the availability and accessibility of mobility data across Member States, with a category dedicated specifically to mobility. This category includes datasets within the scope of the INSPIRE data theme ‘Transport networks’ (as outlined in Annex I of Directive 2007/2/EC) available up to a scale of 1:5 000. Important attributes include the national identification code, geographical position and links with cross-border networks (when available). The INSPIRE directive aims to create an EU spatial data infrastructure for the purposes of EU environmental policies and activities which may have an impact on the environment.
For some Member States (to which Directive 2005/44/EC of the European Parliament and Council on harmonised river information services on the EU’s inland waterways applies), the category includes additional datasets related to inland waterways. These include static data on the characteristics of waterways, presence of obstructions and usage fees, and dynamic data on water depths, river/canal conditions, and possible flood and ice restrictions. Inland electronic and navigational charts are also part of this category, with information on the location of ports, lock and dam contours and other useful navigation data.
Mobility data from Eurostat
Timely and comprehensive data on mobility can be found on the dedicated section of Eurostat’s website. Here, data can be accessed on various types of infrastructure, including railways, roads, maritime and air transport.
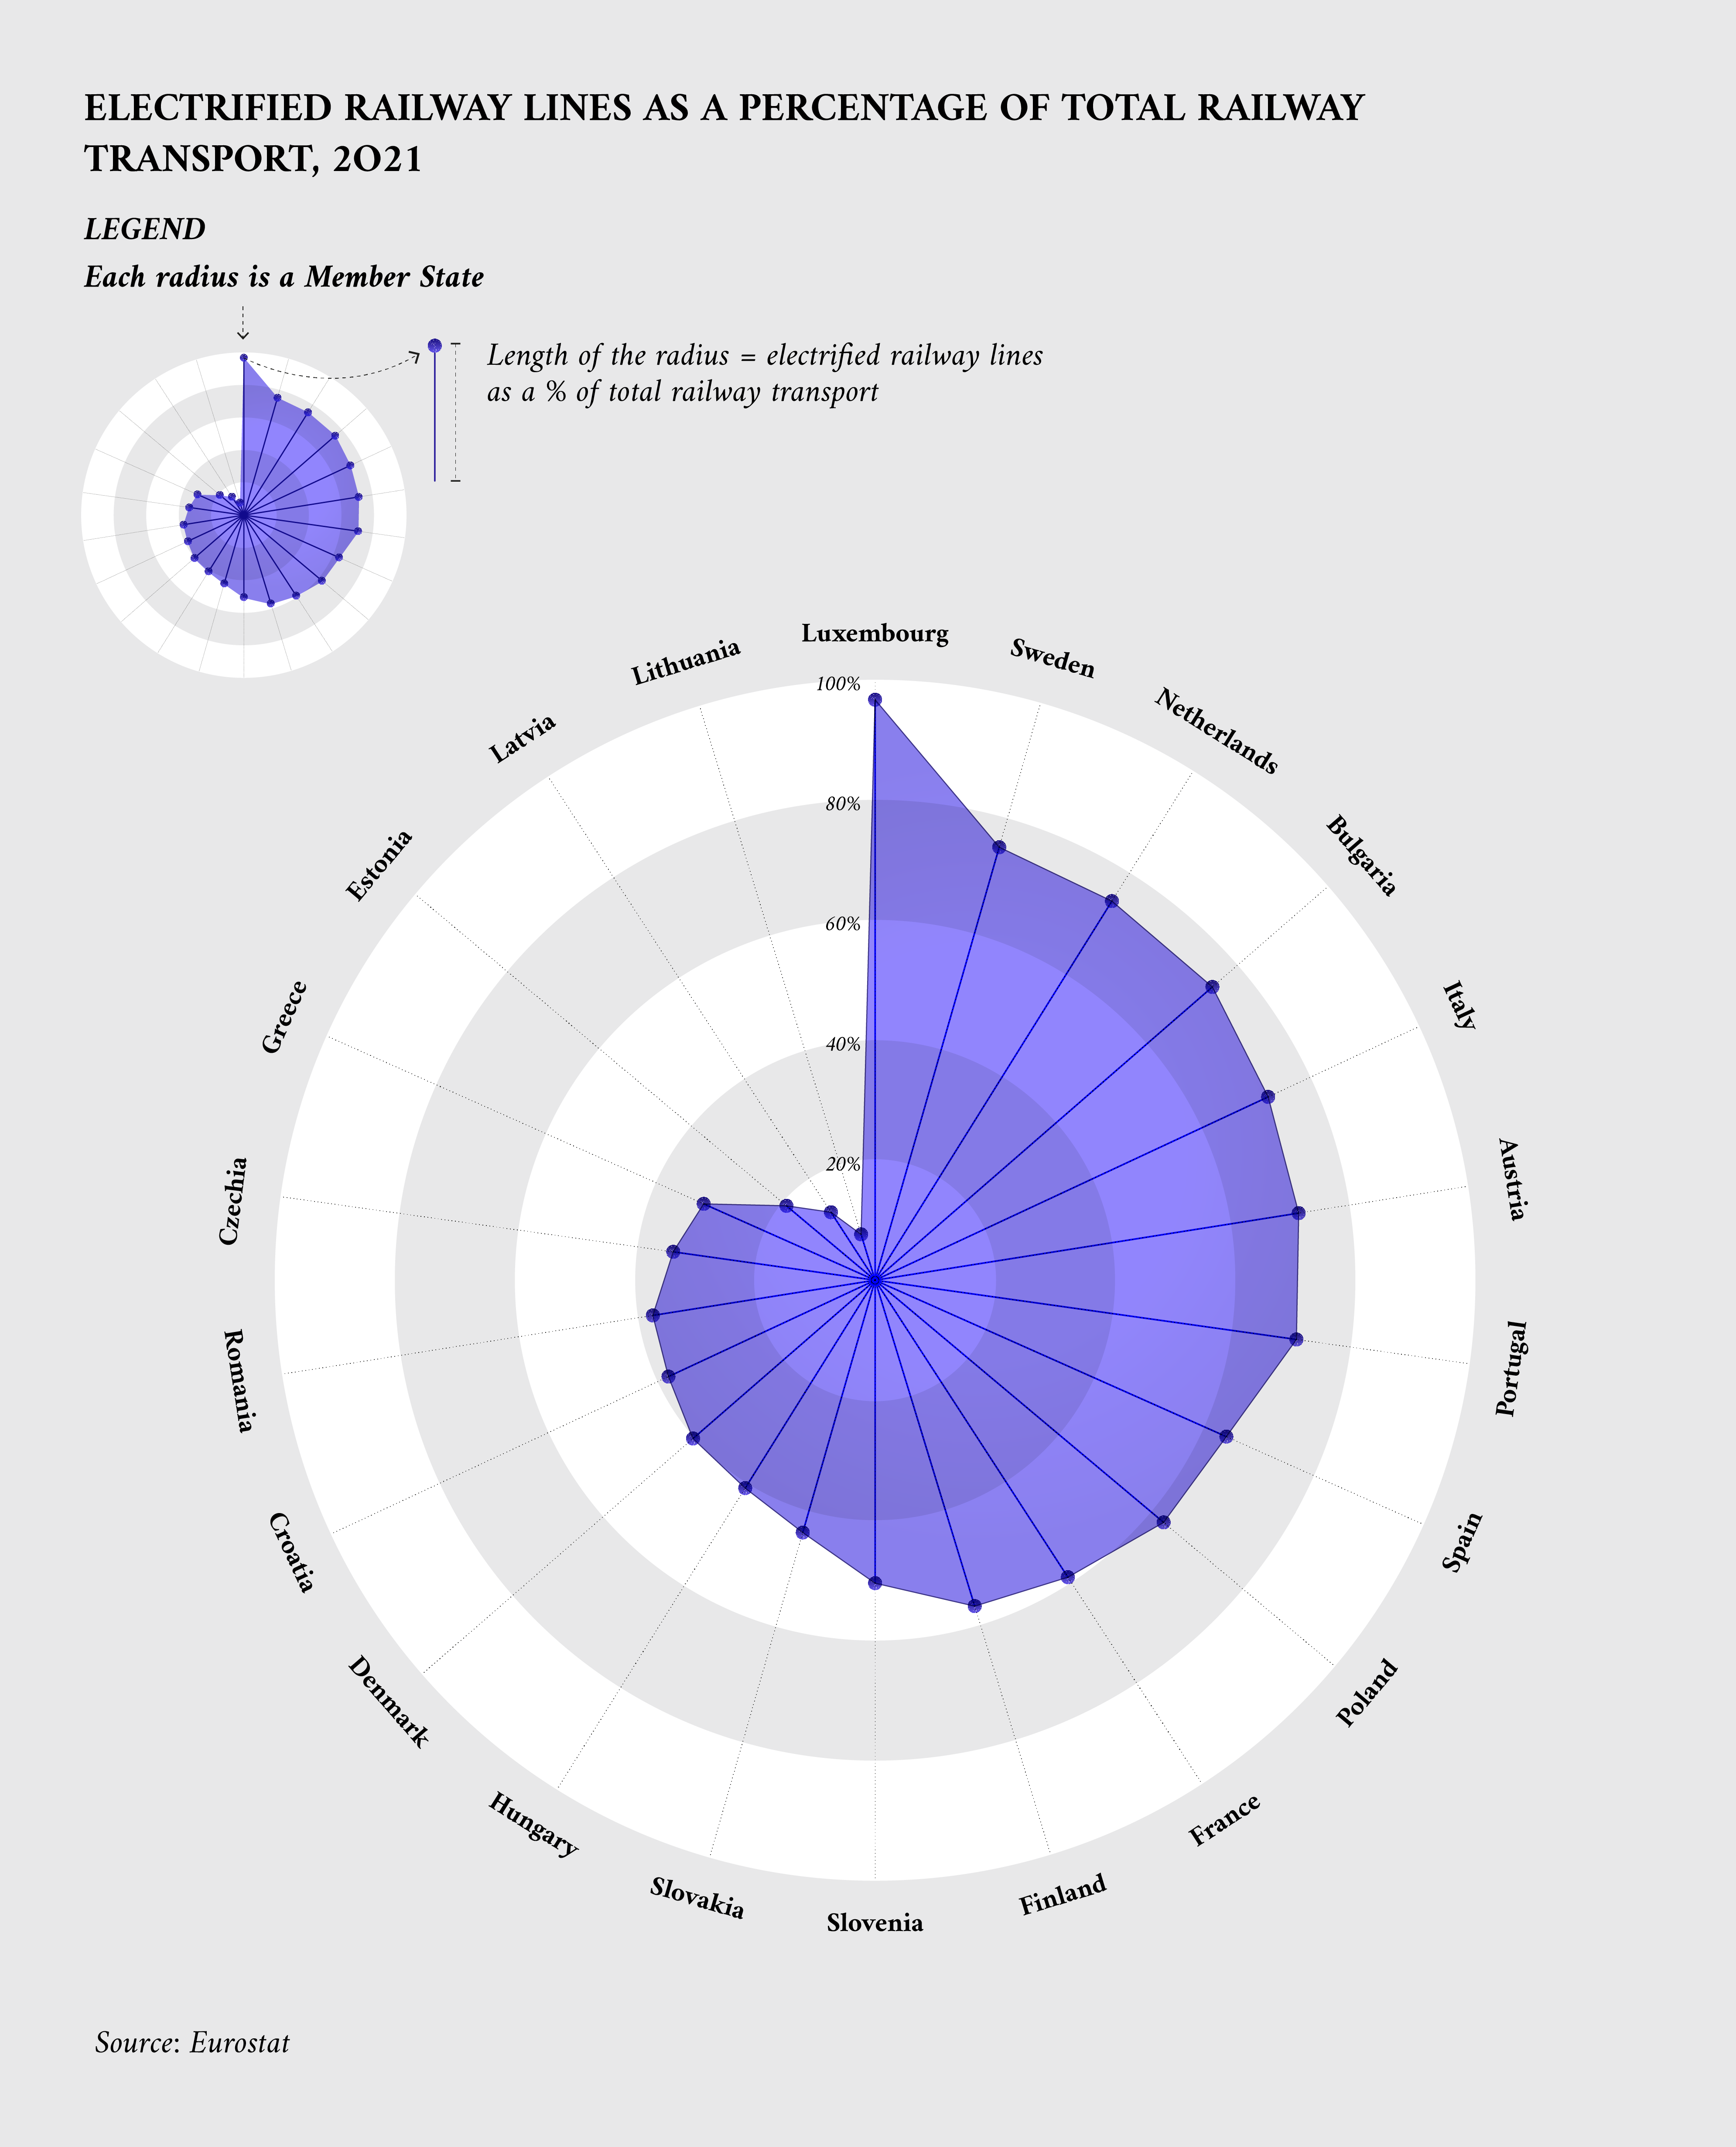
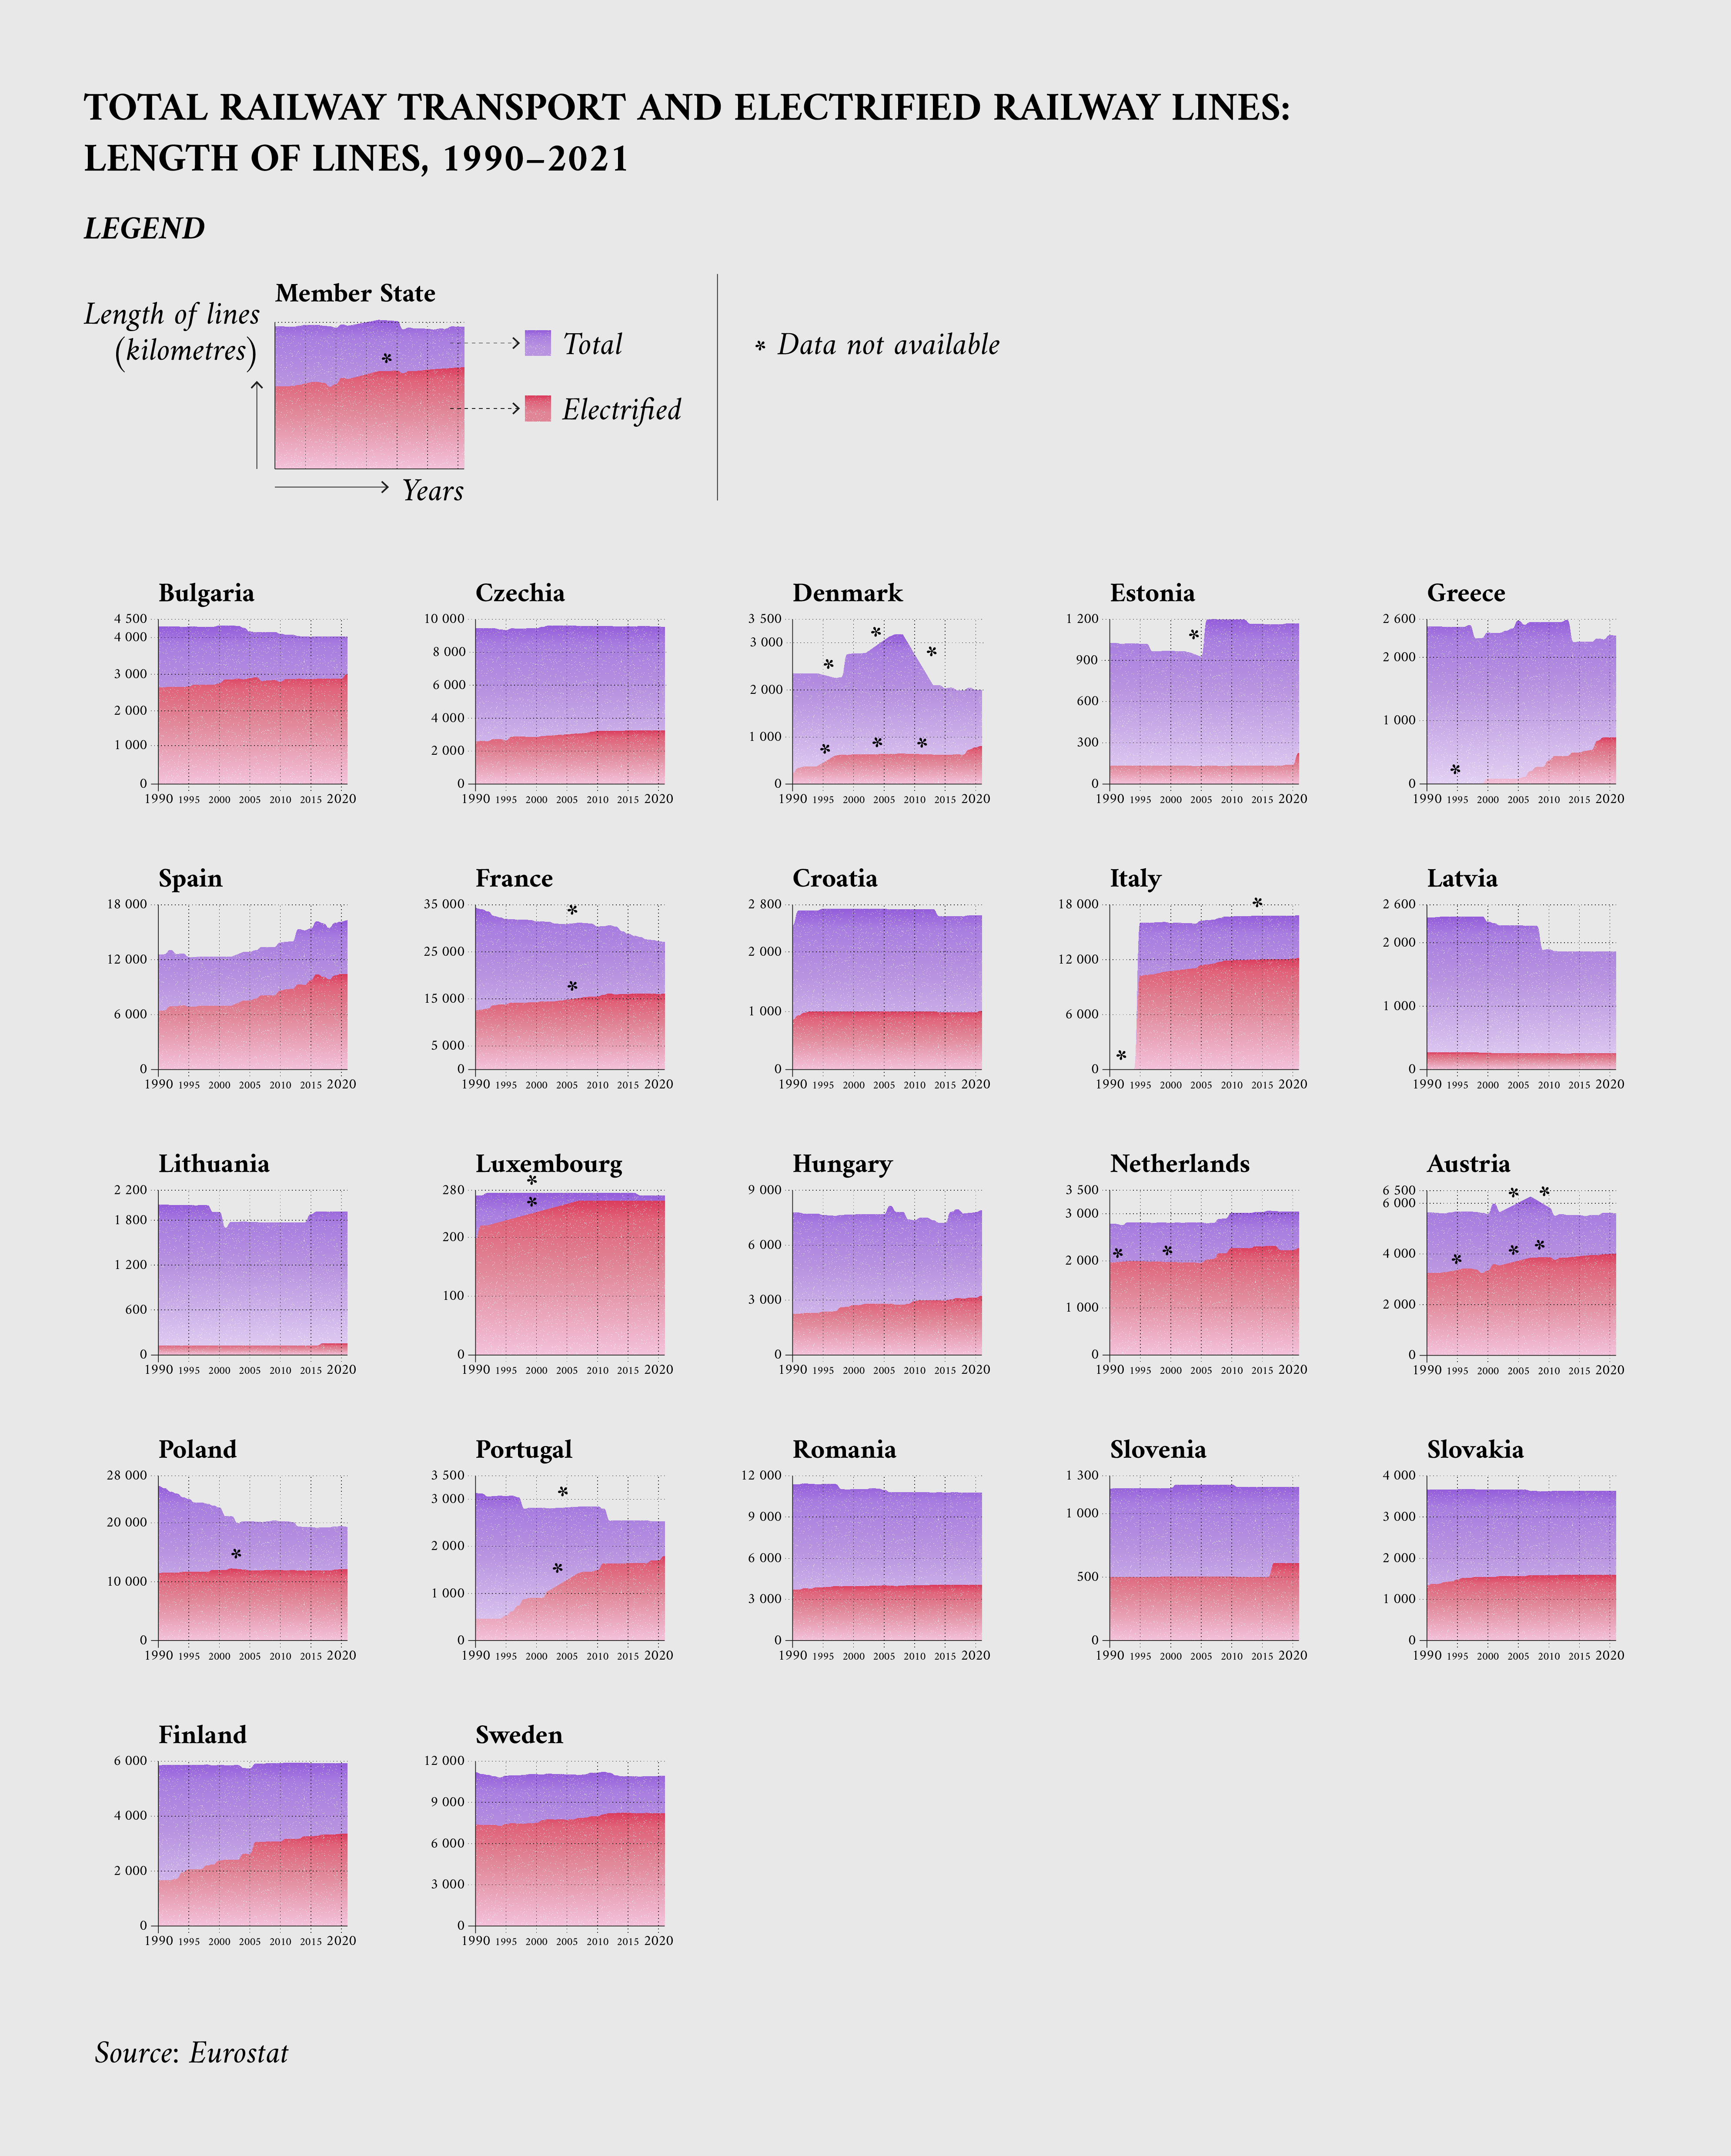
With the help of these data, it is possible to analyse the progress of railway electrification in Member States over recent decades. The dataset provides information about the transport infrastructure and provides insight into the extent to which passenger and freight lines have been converted to electric lines. Electric railway lines also play a significant role in the push for a greener mobility. As an increasing amount of electricity in the EU is generated from renewable sources, a transition from traditional to electric lines contributes to a decrease in greenhouse gas emissions. The visualisation below shows all Member States with available 2021 data.
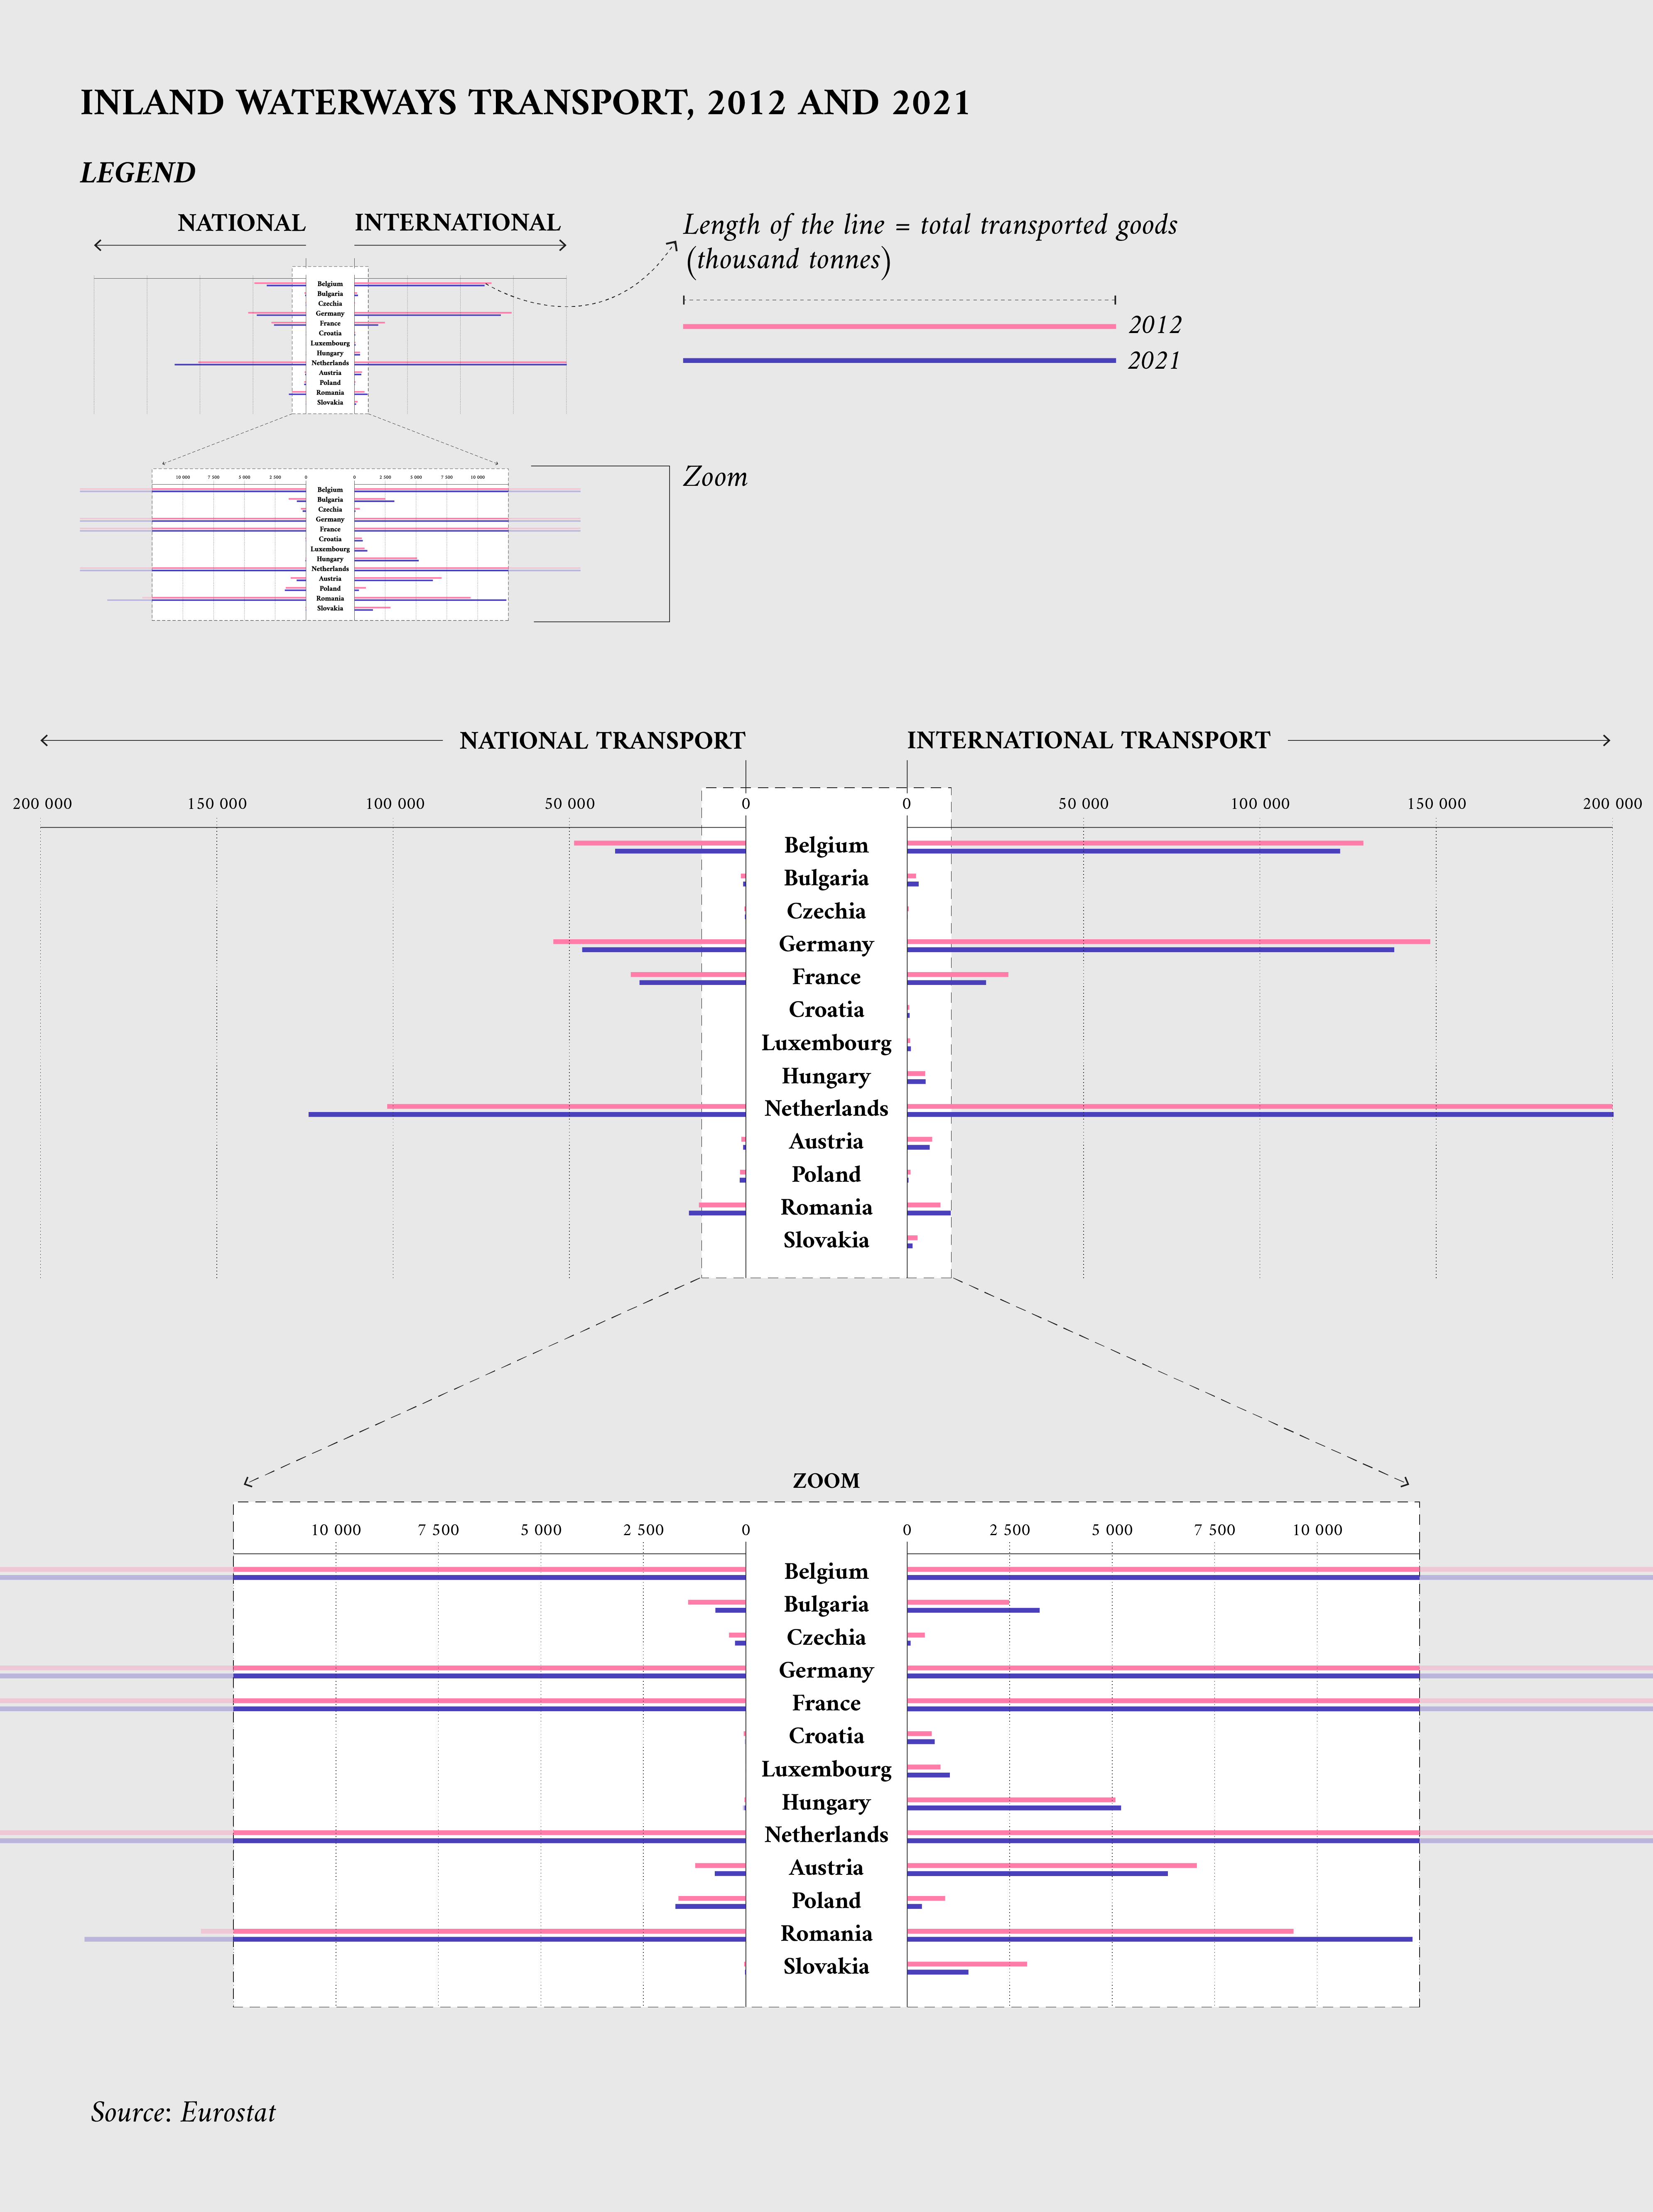
In line with the reduction of greenhouse gas emission from mobility through electrified railways is also an increased role for inland waterway transportation. Inland waterways can help reduce greenhouse gas emissions because water transport is more energy-efficient than road or air transport, meaning that it produces fewer emissions per unit of goods transported. Additionally, barges can carry much larger loads than trucks, meaning that fewer journeys are needed to transport the same amount of goods, further reducing emissions.
Eurostat provides data on this topic, specifically on the volume of goods transported via inland waterways. This data can be used to monitor national or international transportation, the type of packaging used and the specific category of goods being transported, dating back to 2007.
Mobility data from data.europa.eu
The data.europa.eu portal offers a very high number of mobility-related datasets. A search for information about railways yields thousands of results, as do searches for inland waterways and roads. To mention just a few examples, it is possible to find information about electrified railways in France, the features of railways in Slovakia and the real-time status of waterways in the Netherlands.
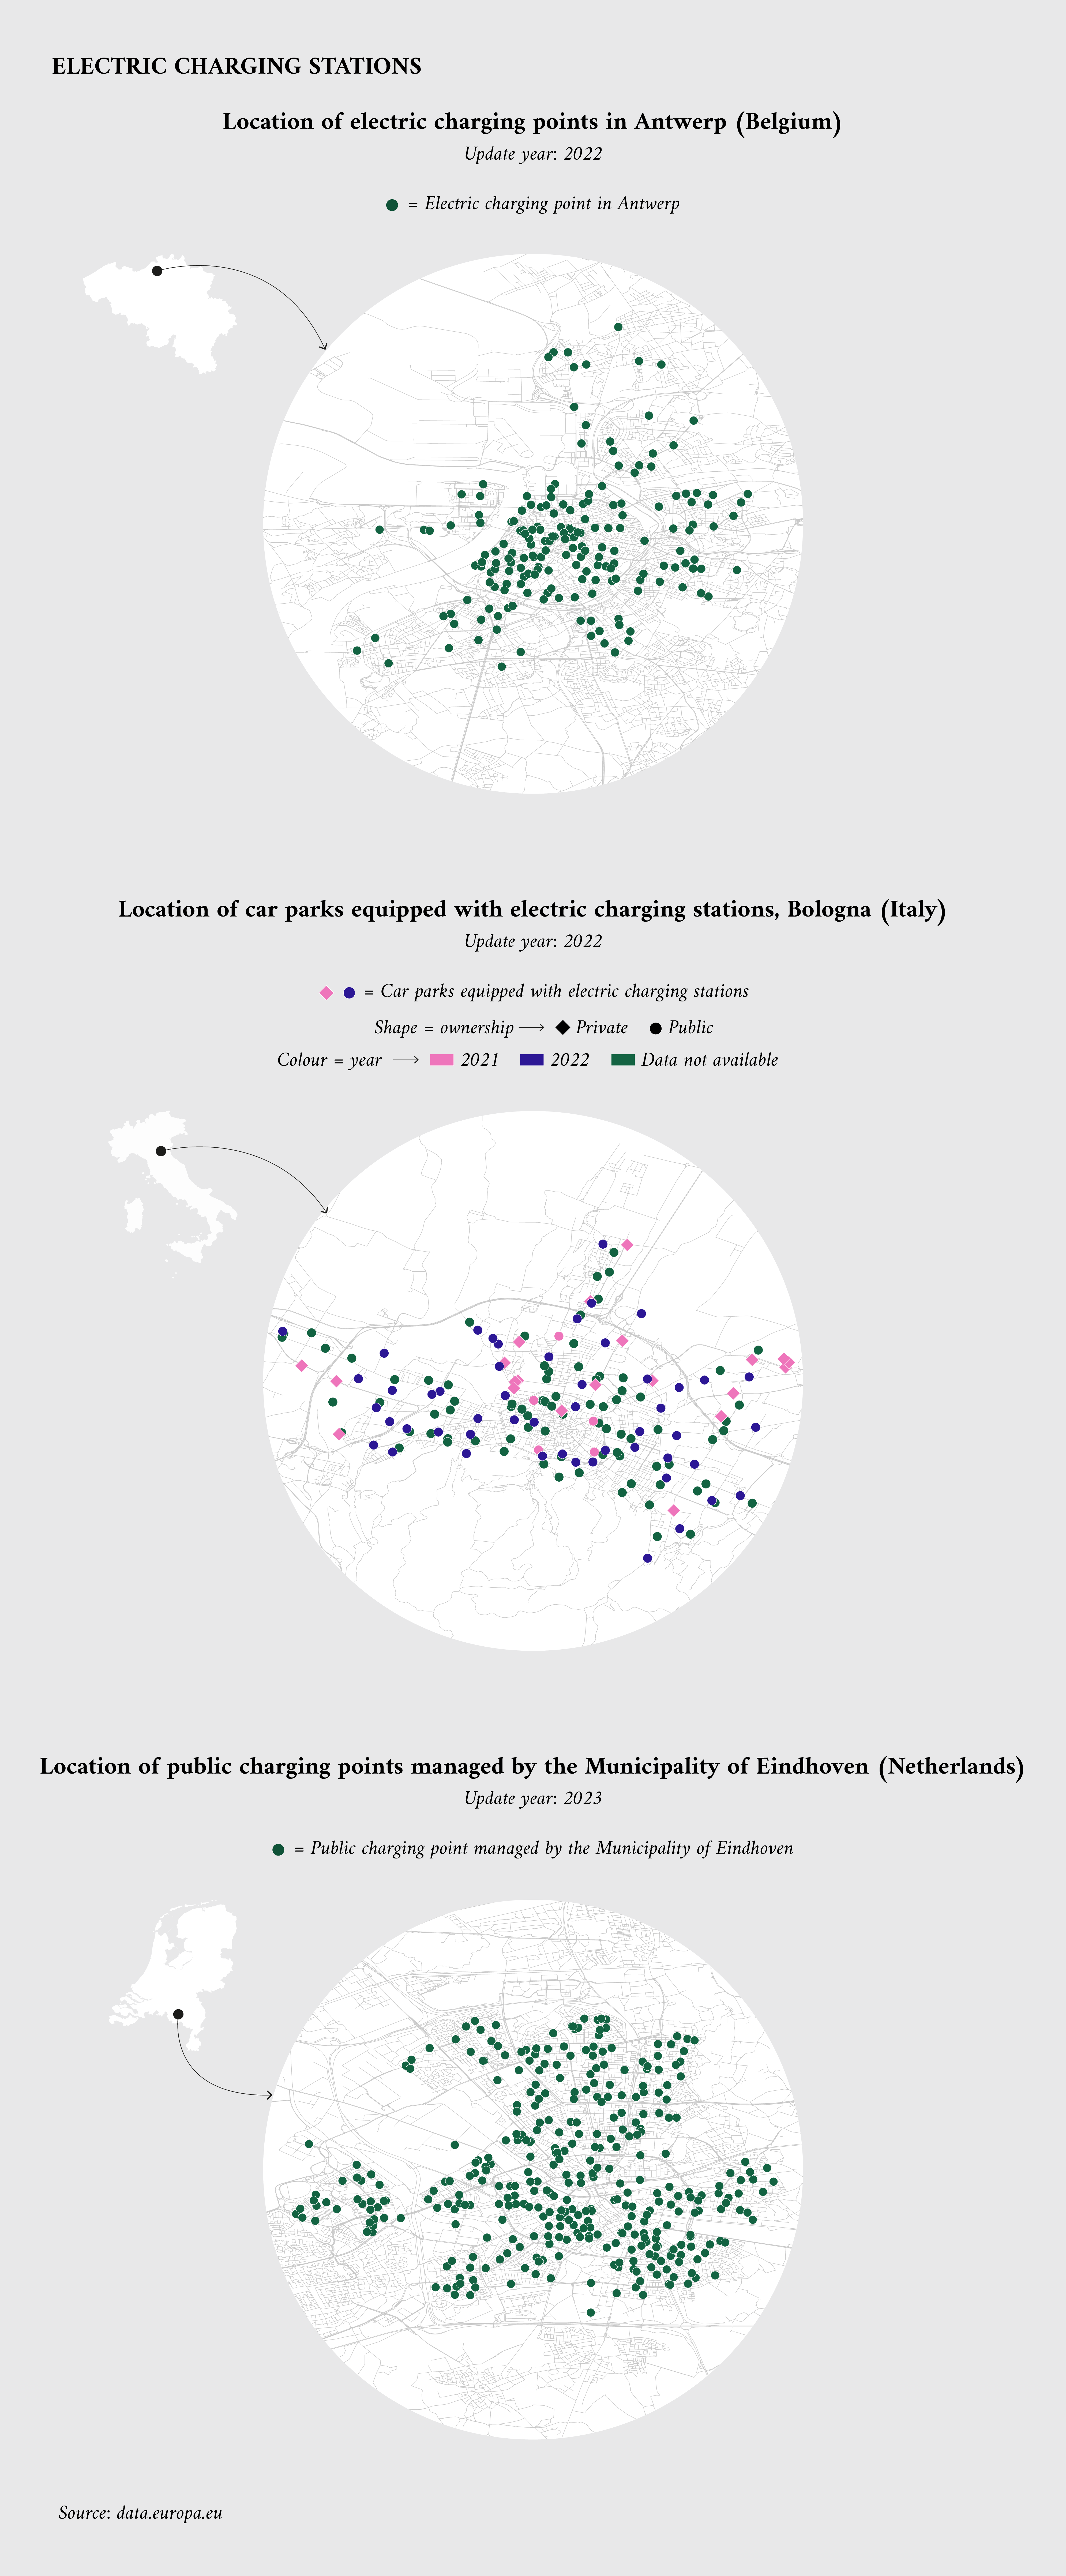
Tracking the number and location of electric-vehicle recharging stations – another key component in the push for a greener mobility – is possible as well. Several national and local authorities have uploaded datasets that detail how many of those stations are available all across the EU, for example those near Antwerp (Belgium), Bologna (Italy) or Eindhoven (Netherlands). The following graphic shows the position of some charging stations in those areas.
Mobility data from other sources
The European Commission’s Directorate-General for Mobility and Transport operates the TENtec interactive map viewer, a map of the EU transport system where users can overlay various data layers. On this platform, users can find information about the various components of the trans-European transport network, including inland waterways, passenger and freight railways, roads, urban nodes, ports and airports. In addition, users can access data on the location of alternative fuel charging stations, such as gas, hydrogen and electric. The Directorate-General for Mobility and Transport website also provides access to news, reports and other relevant information.
The EU’s Joint Research Centre has conducted scientific research on mobility and made the results available on the data.europa.eu portal. One study analysed the impact of reducing subsidies for electric cars, while another modelled the effect of the widespread adoption of electric cars on greenhouse gas emissions.
The European Environment Agency website has a section dedicated to transport and the transition to a more sustainable transport system. It includes an annual report that tracks the progress of the transport sector towards EU policy targets, provides updates on electric vehicles and offers a series of relevant datasets in its data services section.
Also worth mentioning are:
- the European Railway Agency, which collects and publishes data on rail transport, including data on rail infrastructure, rolling stock and rail traffic volumes, and plans and reports about the railway system;
- the European Aviation Safety Agency, which provides data on aviation safety, including data on air traffic and the safety performance of EU airlines, and information about sustainability in aviation;
- the European Maritime Safety Agency, which collects and publishes data on maritime transport, including data on ship movements, ports and maritime accidents.
Conclusions
Mobility data can play a crucial role in promoting greener and more sustainable mobility for both people and freight. This data can be analysed to understand travel patterns, identify areas where alternative modes of transport, such as public transport, cycling or walking, can be promoted and optimise the use of the existing transportation infrastructure. It can also help in the planning and implementation of new, sustainable transportation solutions, such as electric-vehicle charging stations, car-sharing schemes and green freight initiatives.
By providing valuable insights into mobility behaviour, mobility data can support the transition towards a low-carbon, efficient and safe transportation system that benefits the environment and society as a whole.
To download the visualisations, click on the following: HVD overview, electrified railways 2021, electrified railways 1990-2021, inland waterways, charging stations.
To download the data behind the visualisations, click on the following: mobility data
Article by Davide Mancino
Data visualisations by Federica Fragapane
