Let’s have a look at the following tidy table, and try to do some very basic analysis on the data.
| country | year | cases | population |
|---|---|---|---|
| Belgium | 2020 | 14.444 | 11.522.440 |
| Belgium | 2021 | 14.791 | 11.554.767 |
| Bulgaria | 2020 | 23.128 | 6.916.548 |
| Bulgaria | 2021 | 22.305 | 6.951.482 |
| Czechia | 2020 | 8.610 | 10.494.836 |
| Czechia | 2021 | 8.990 | 10.693.939 |
If you are interested in the cases rate for each year in each country, calculating the rate is a matter of adding a rate column, and dividing the cases values in each row by the population value in the same row (possibly multiplying by 100.000 to get the cases per 100.000 inhabitants). This operation is straightforward in many software tools, including spreadsheet programmes like Microsoft Excel.
Now imagine that you are interested in the total (or average) number of cases over all countries and years. Calculating these aggregate numbers is as easy as taking the sum or the average of the cases column in the tidy data table.
Both of the little exercises above illustrate the advantage of working with tidy data: operations like deriving new columns and aggregating data become much easier when the data is tidy.
Tidy data is a prerequisite for making visualisations based on the Grammar of Graphics. The schema below illustrates why. In the Grammar of Graphics, variables in the data are mapped to the visual properties (the aesthetics) of geometrical objects (see Overview of the Grammar of Graphics building blocks).
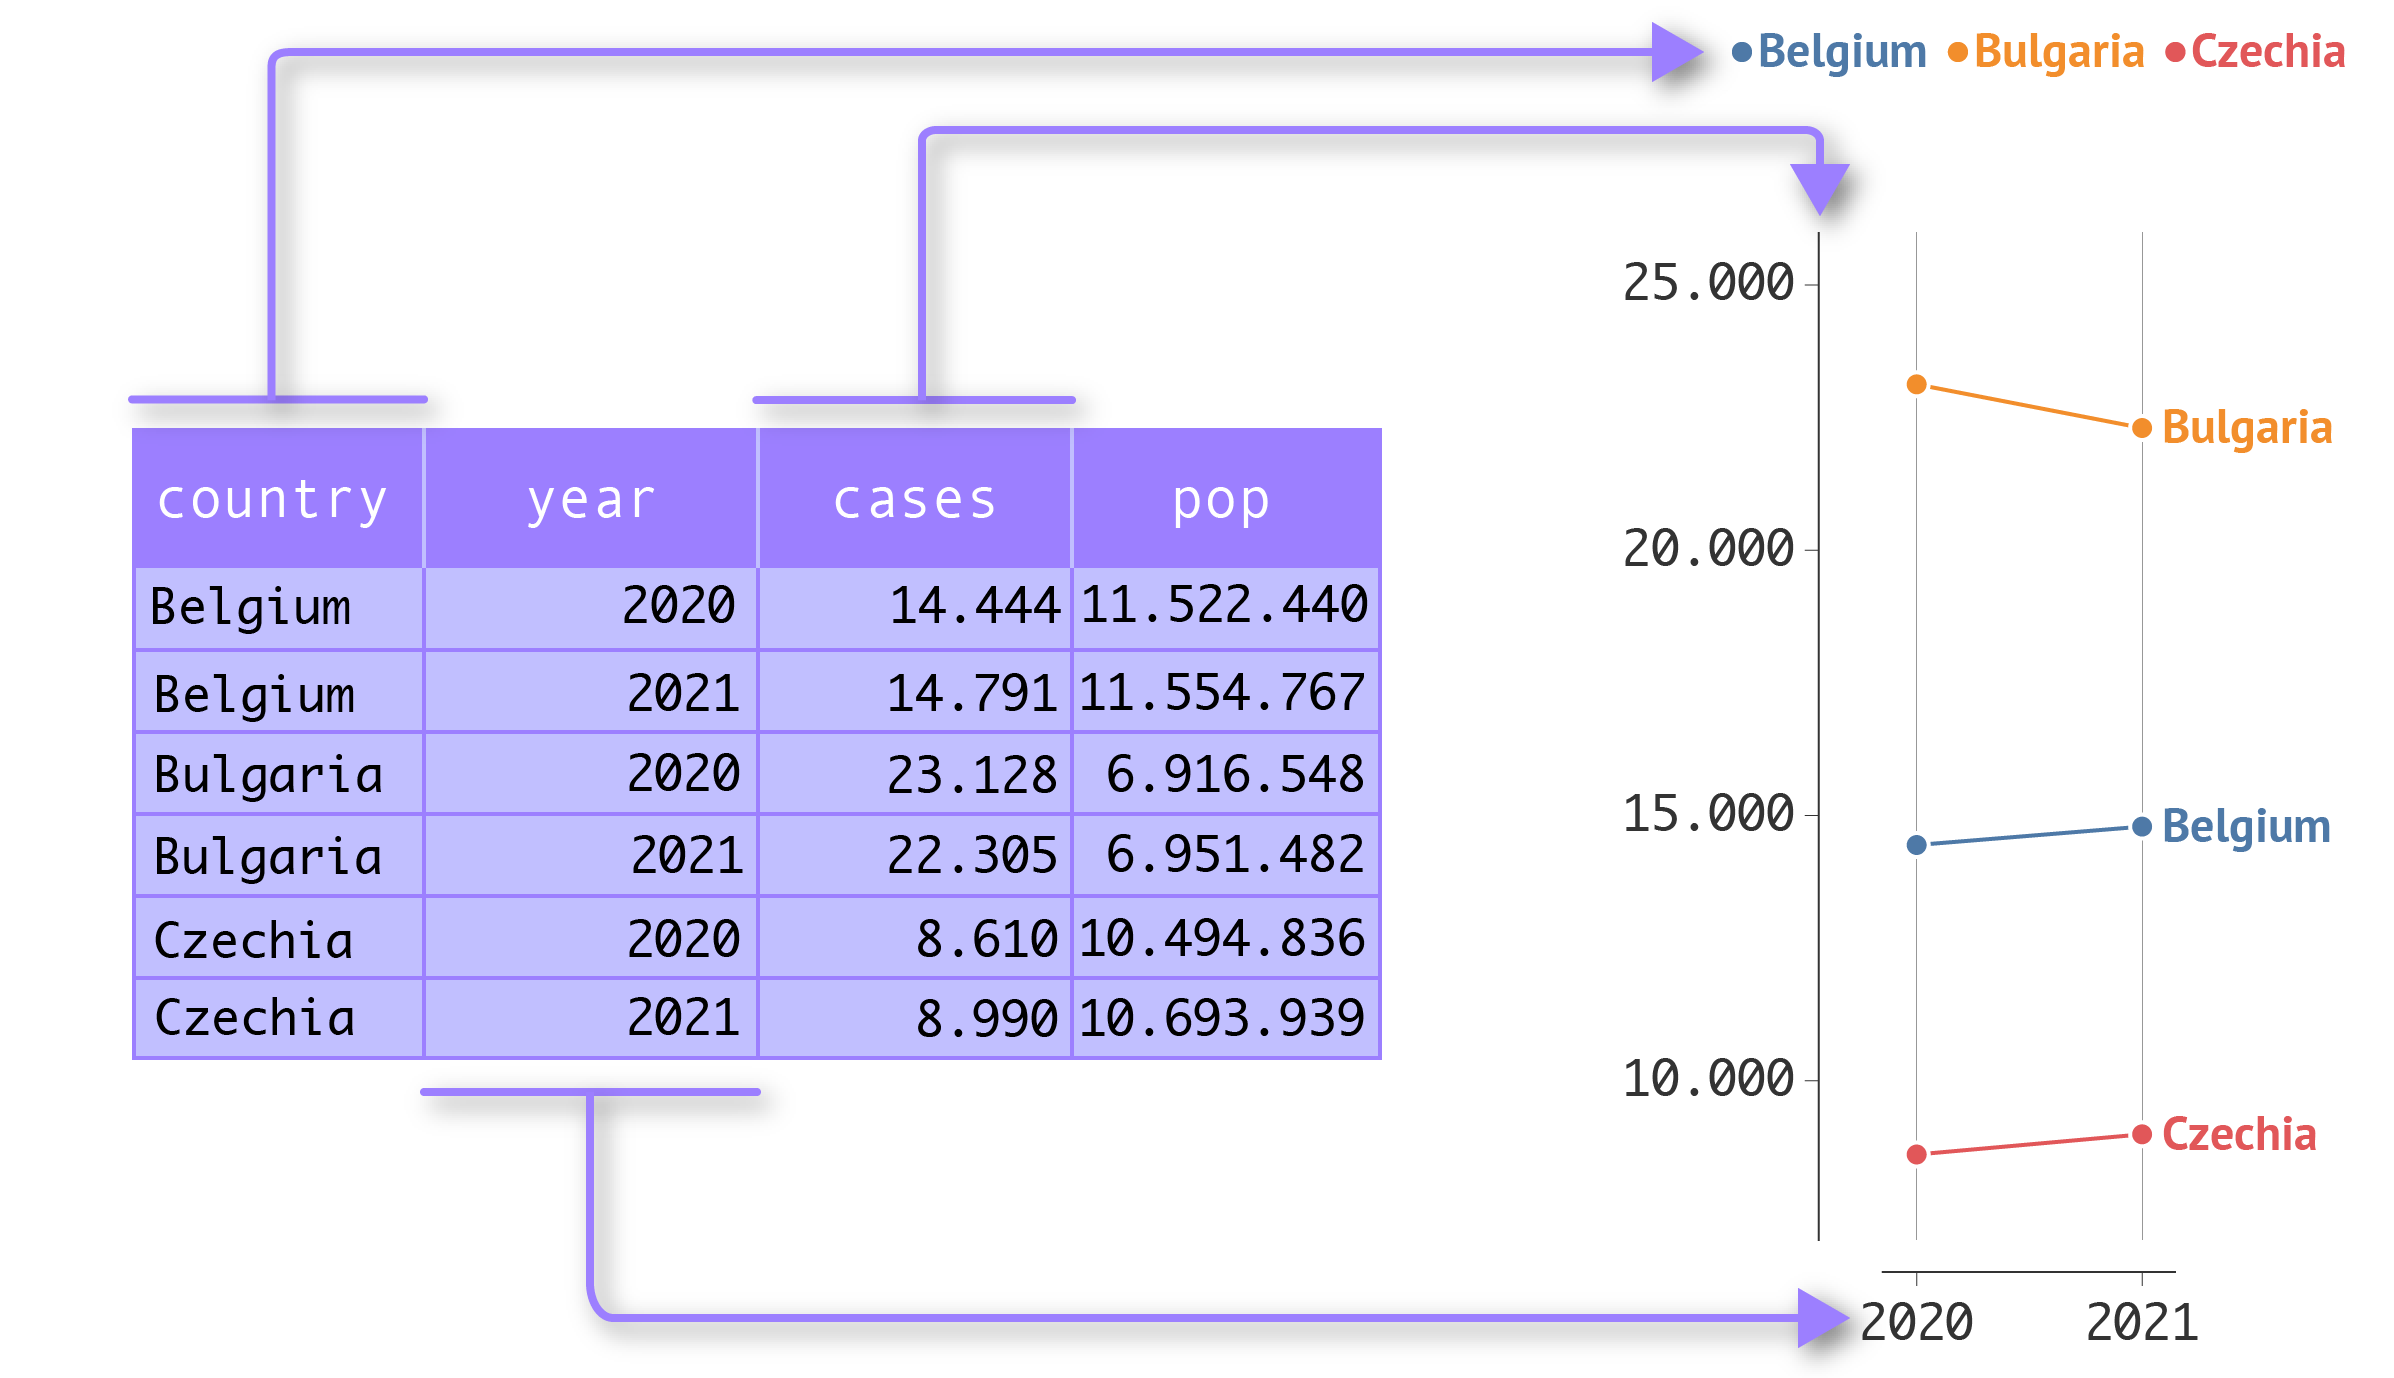
Source: Maarten Lambrechts, CC BY SA 4.0
With untidy data, this direct mapping between columns/variables and aesthetics is not possible: a column could contain multiple values or values for more than one variable, or a variable might be spread over multiple columns. So, with untidy data, making visualisations based on the Grammar of Graphics is not possible: the data needs to be tidied first before it can be used for visualisation.