The target audience of your visualisation also plays an important role in your choice of chart type.
In the first place, you need to consider your audience’s familiarity with the data. Given the concepts layed out in the cognitive load pages, your audience risks becoming overwhelmed by the information you are exposing them to when you present unfamiliar data in combination with an unfamiliar or complex chart. So it is best to use complex and more innovative chart types only with data your target audience is familiar with.
Some knowledge fields have a long tradition in using more complex data visualisations for specific data. One example is the ternary plot, which is used in soil sciences to classify soils.
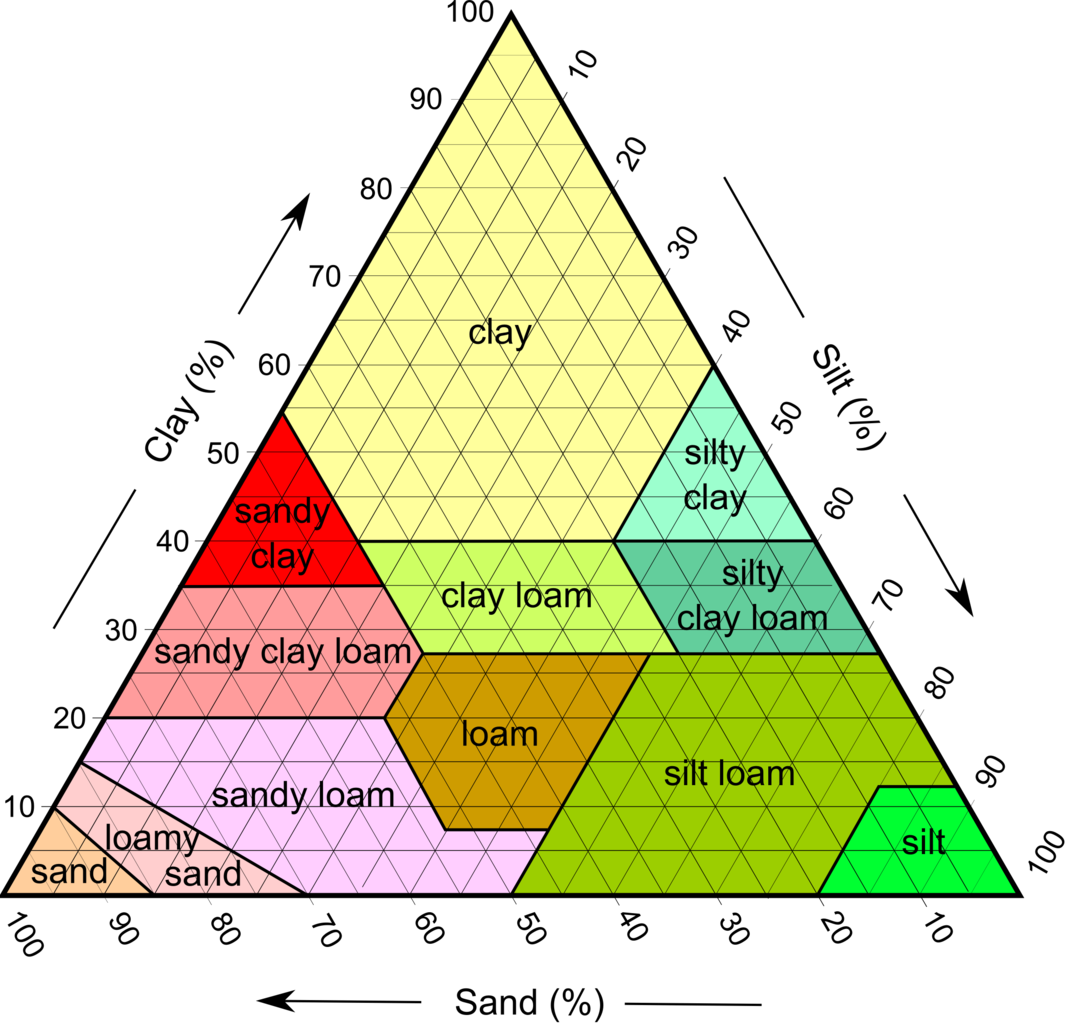
Source: Mikenorton, CC-BY-SA 3.0
People working in soil sciences have no difficulties reading and using these ternary plots. But lay people may have to spend some time with a ternary plot before they can extract any insights from them. In some cases, using a chart type like a ternary plot is simply the best option to tell the story in the data to your audience. When the data is not too complex or new to your audience, and you think the “graphicacy” of your audience (the level at which they are able to read and interpret visualisations) is high enough, it is definitely worth a try.
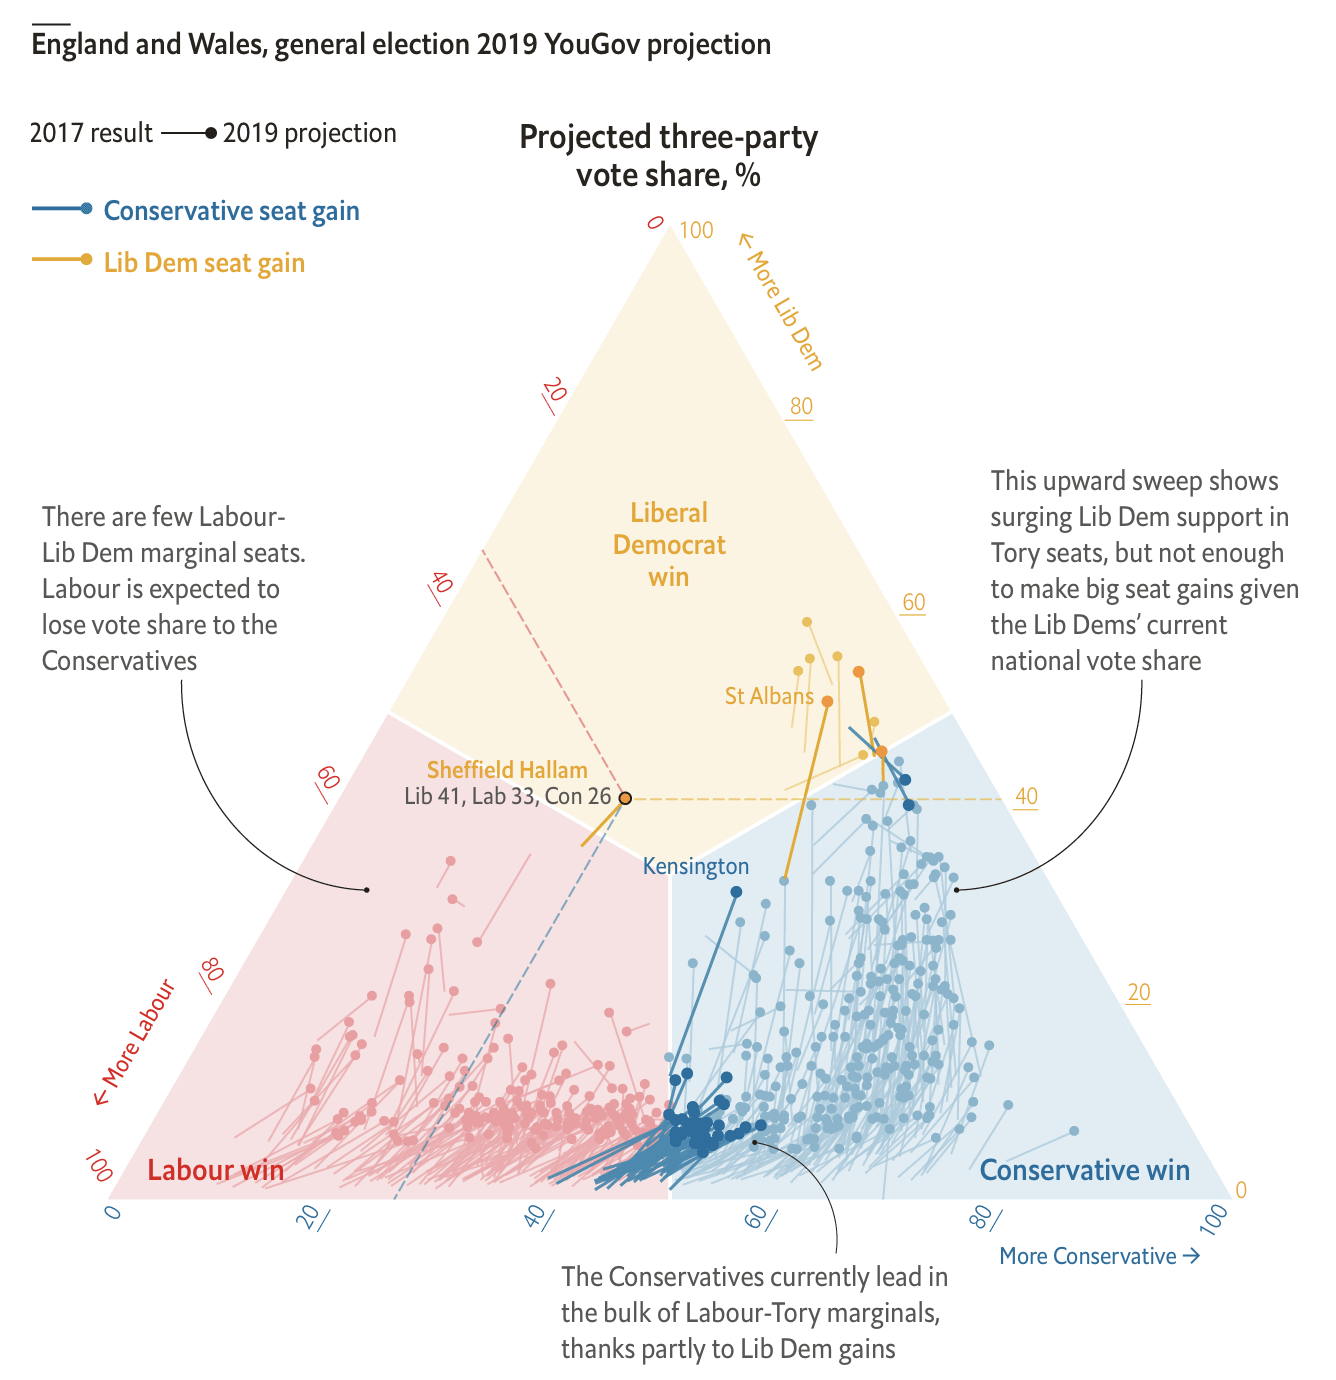
A ternary plot about UK election projections. Source: Voting Lib Dem could hurt the Tories as much as Labour, economist.com
Techniques extist to help the reader understand a new chart type, learn more about them on theHow to introduce less common chart types page.
Gauging the graphicacy of your audience is not always easy. An easy test is letting someone you consider to be part of the the target audience to look at your chart (without you explaining the chart) and let them reason and talk about what they see on the chart out loud. When you notice they are getting confused, or when they draw incorrect conclusions from the visualisation, you know you need to change its design, replace the data displayed or consider a different chart type.