Visual annotations can also take the form of icons, images and illustrations. Consider the following chart, taken from a study describing the behaviour of dogs when their owner paid attention to stuffed dogs and to 2 other objects:
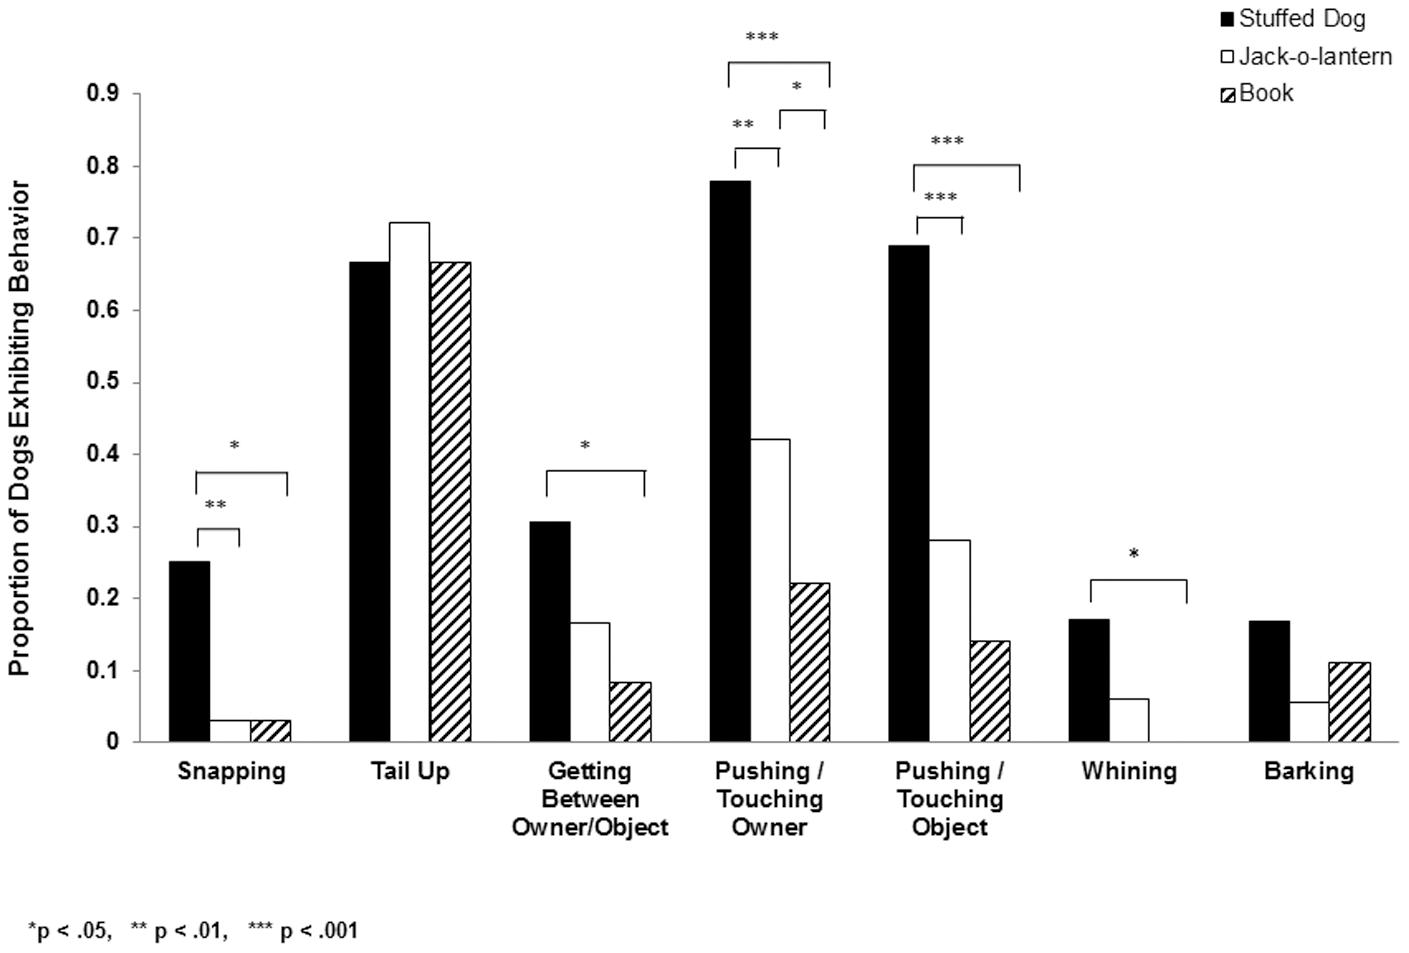
Source: Jealousy in Dogs, PLOS ONE
The behaviour of the jealous dogs on the x axis is described in words. As a reader, especially as a dog-owning reader, you might have an idea about how this dog behaviour looks like in reality. But now compare the above chart with the one below, where the dog behaviour is illustrated with drawings.
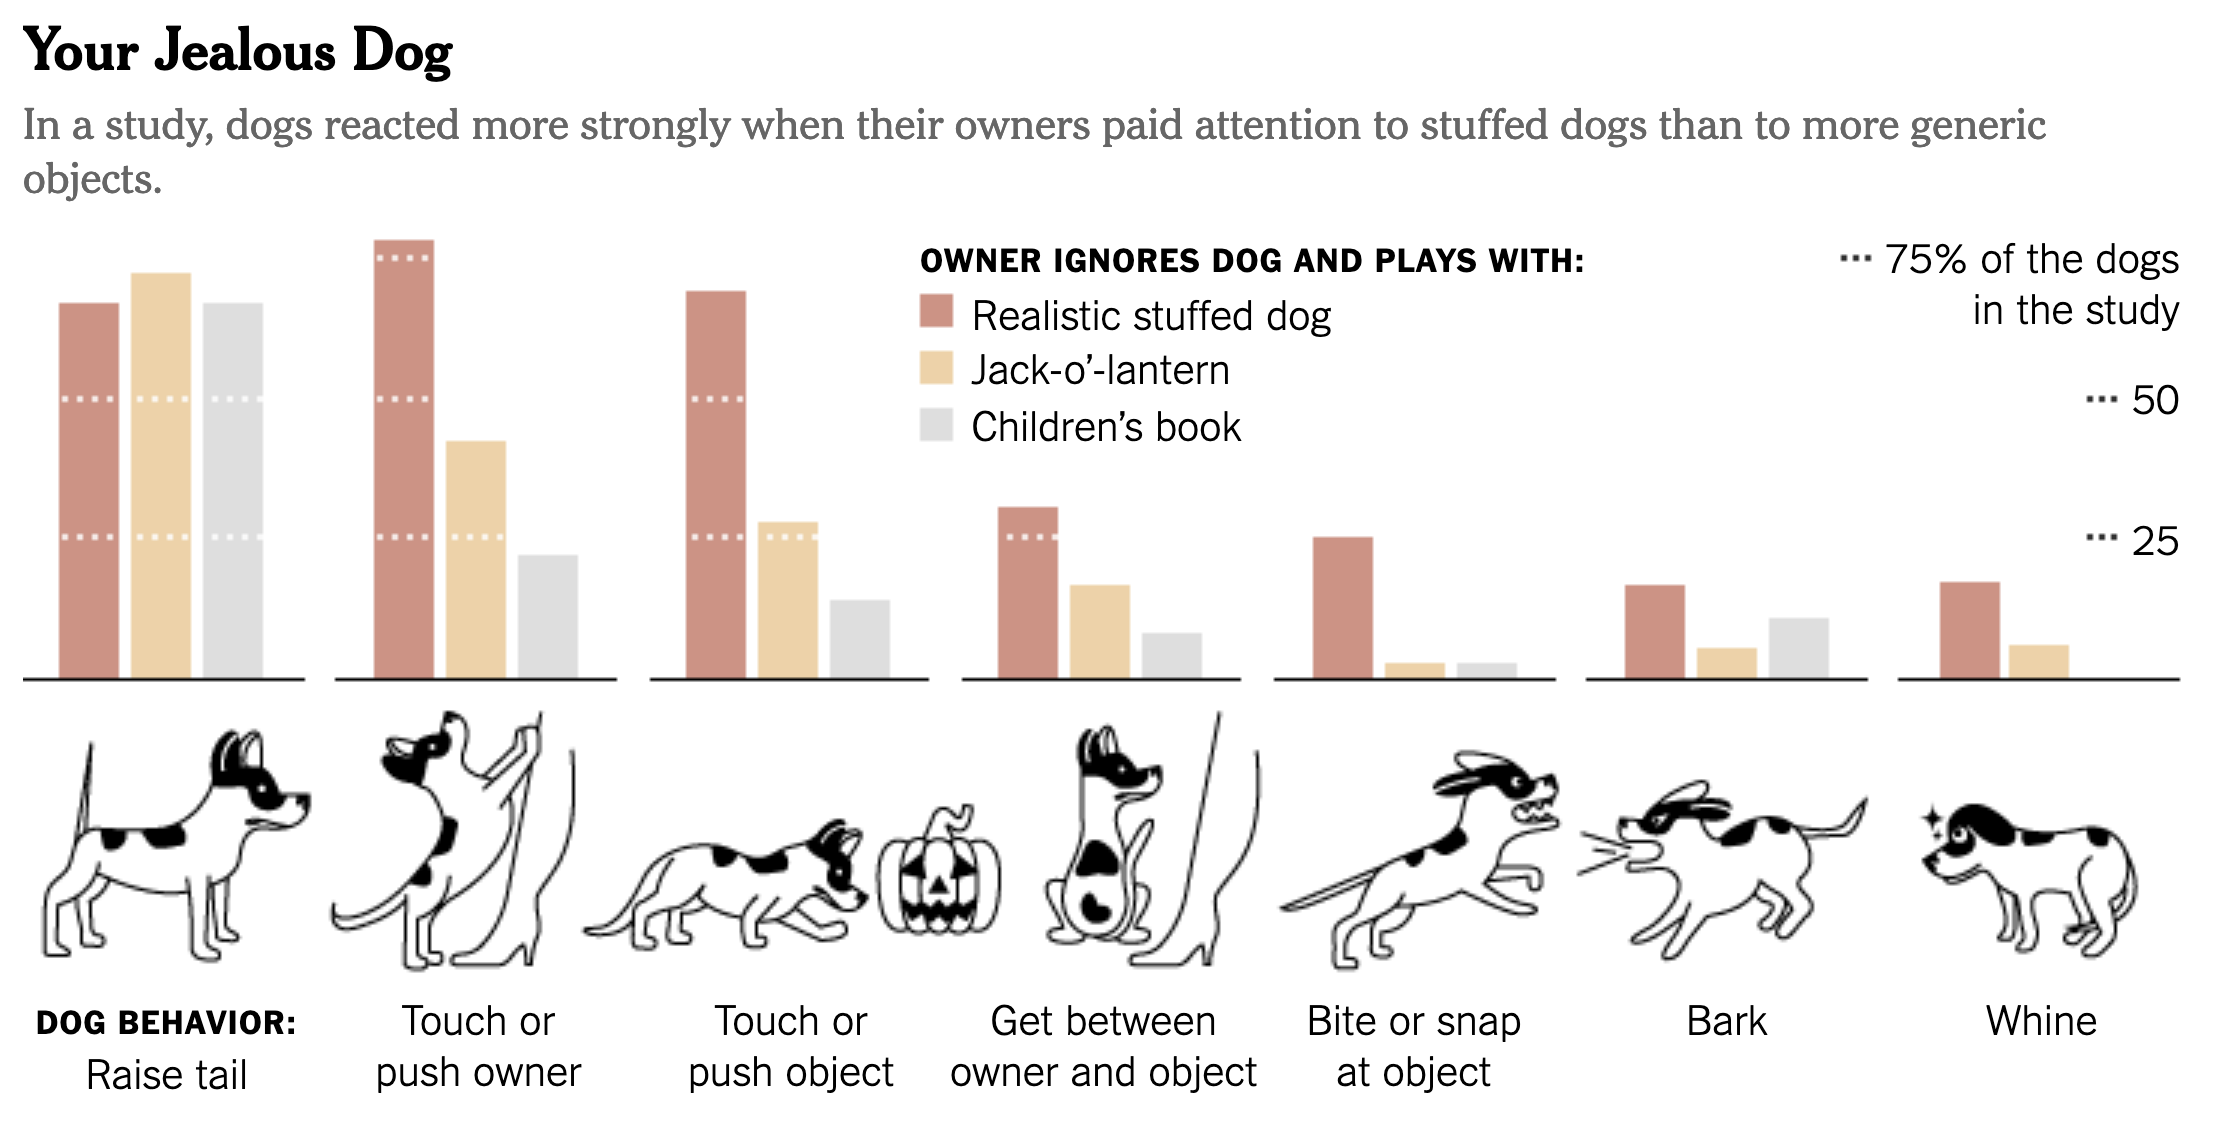
Source: Inside Man’s Best Friend, Study Says, May Lurk a Green-Eyed Monster, nytimes.com
This reworked chart is not only more fun to look at, chances are that you will also remember the chart and its message better.
The same research that discovered how important visualisation titles are, also looked at the effect of adding pictograms to visualisations.
This is one of the conclusions of the study:
Pictograms do not hinder the memory or understanding of a visualization. Visualizations that contain pictograms tend to be better recognized and described. Pictograms can often serve as visual hooks into memory, allowing a visualization to be retrieved from memory more effectively. If designed well, pictograms can help convey the message of the visualization, as an alternative, and addition to text.
Adding pictograms to text descriptions creates redundancy: the same feature is described both with an image and with text. This also can help the understanding of a visualisation:
Redundancy helps with visualization recall and understanding. When redundancy is present, to communicate quantitative values (data redundancy) or the main trends or concepts of a visualization (message redundancy), the data is presented more clearly as measured through better-quality descriptions and a better understanding of the message of the visualization at recall.
One of the most common icons used in data visualisation, are country flags. They can give a visualisation a more attractive look and help readers quickly recognise and find countries of their interest. But country flags shouldn’t be the only cue to identify countries. Country names, or at least country codes, should be provided as labels or tooltips too, because not everyone is familiar with all country flags.
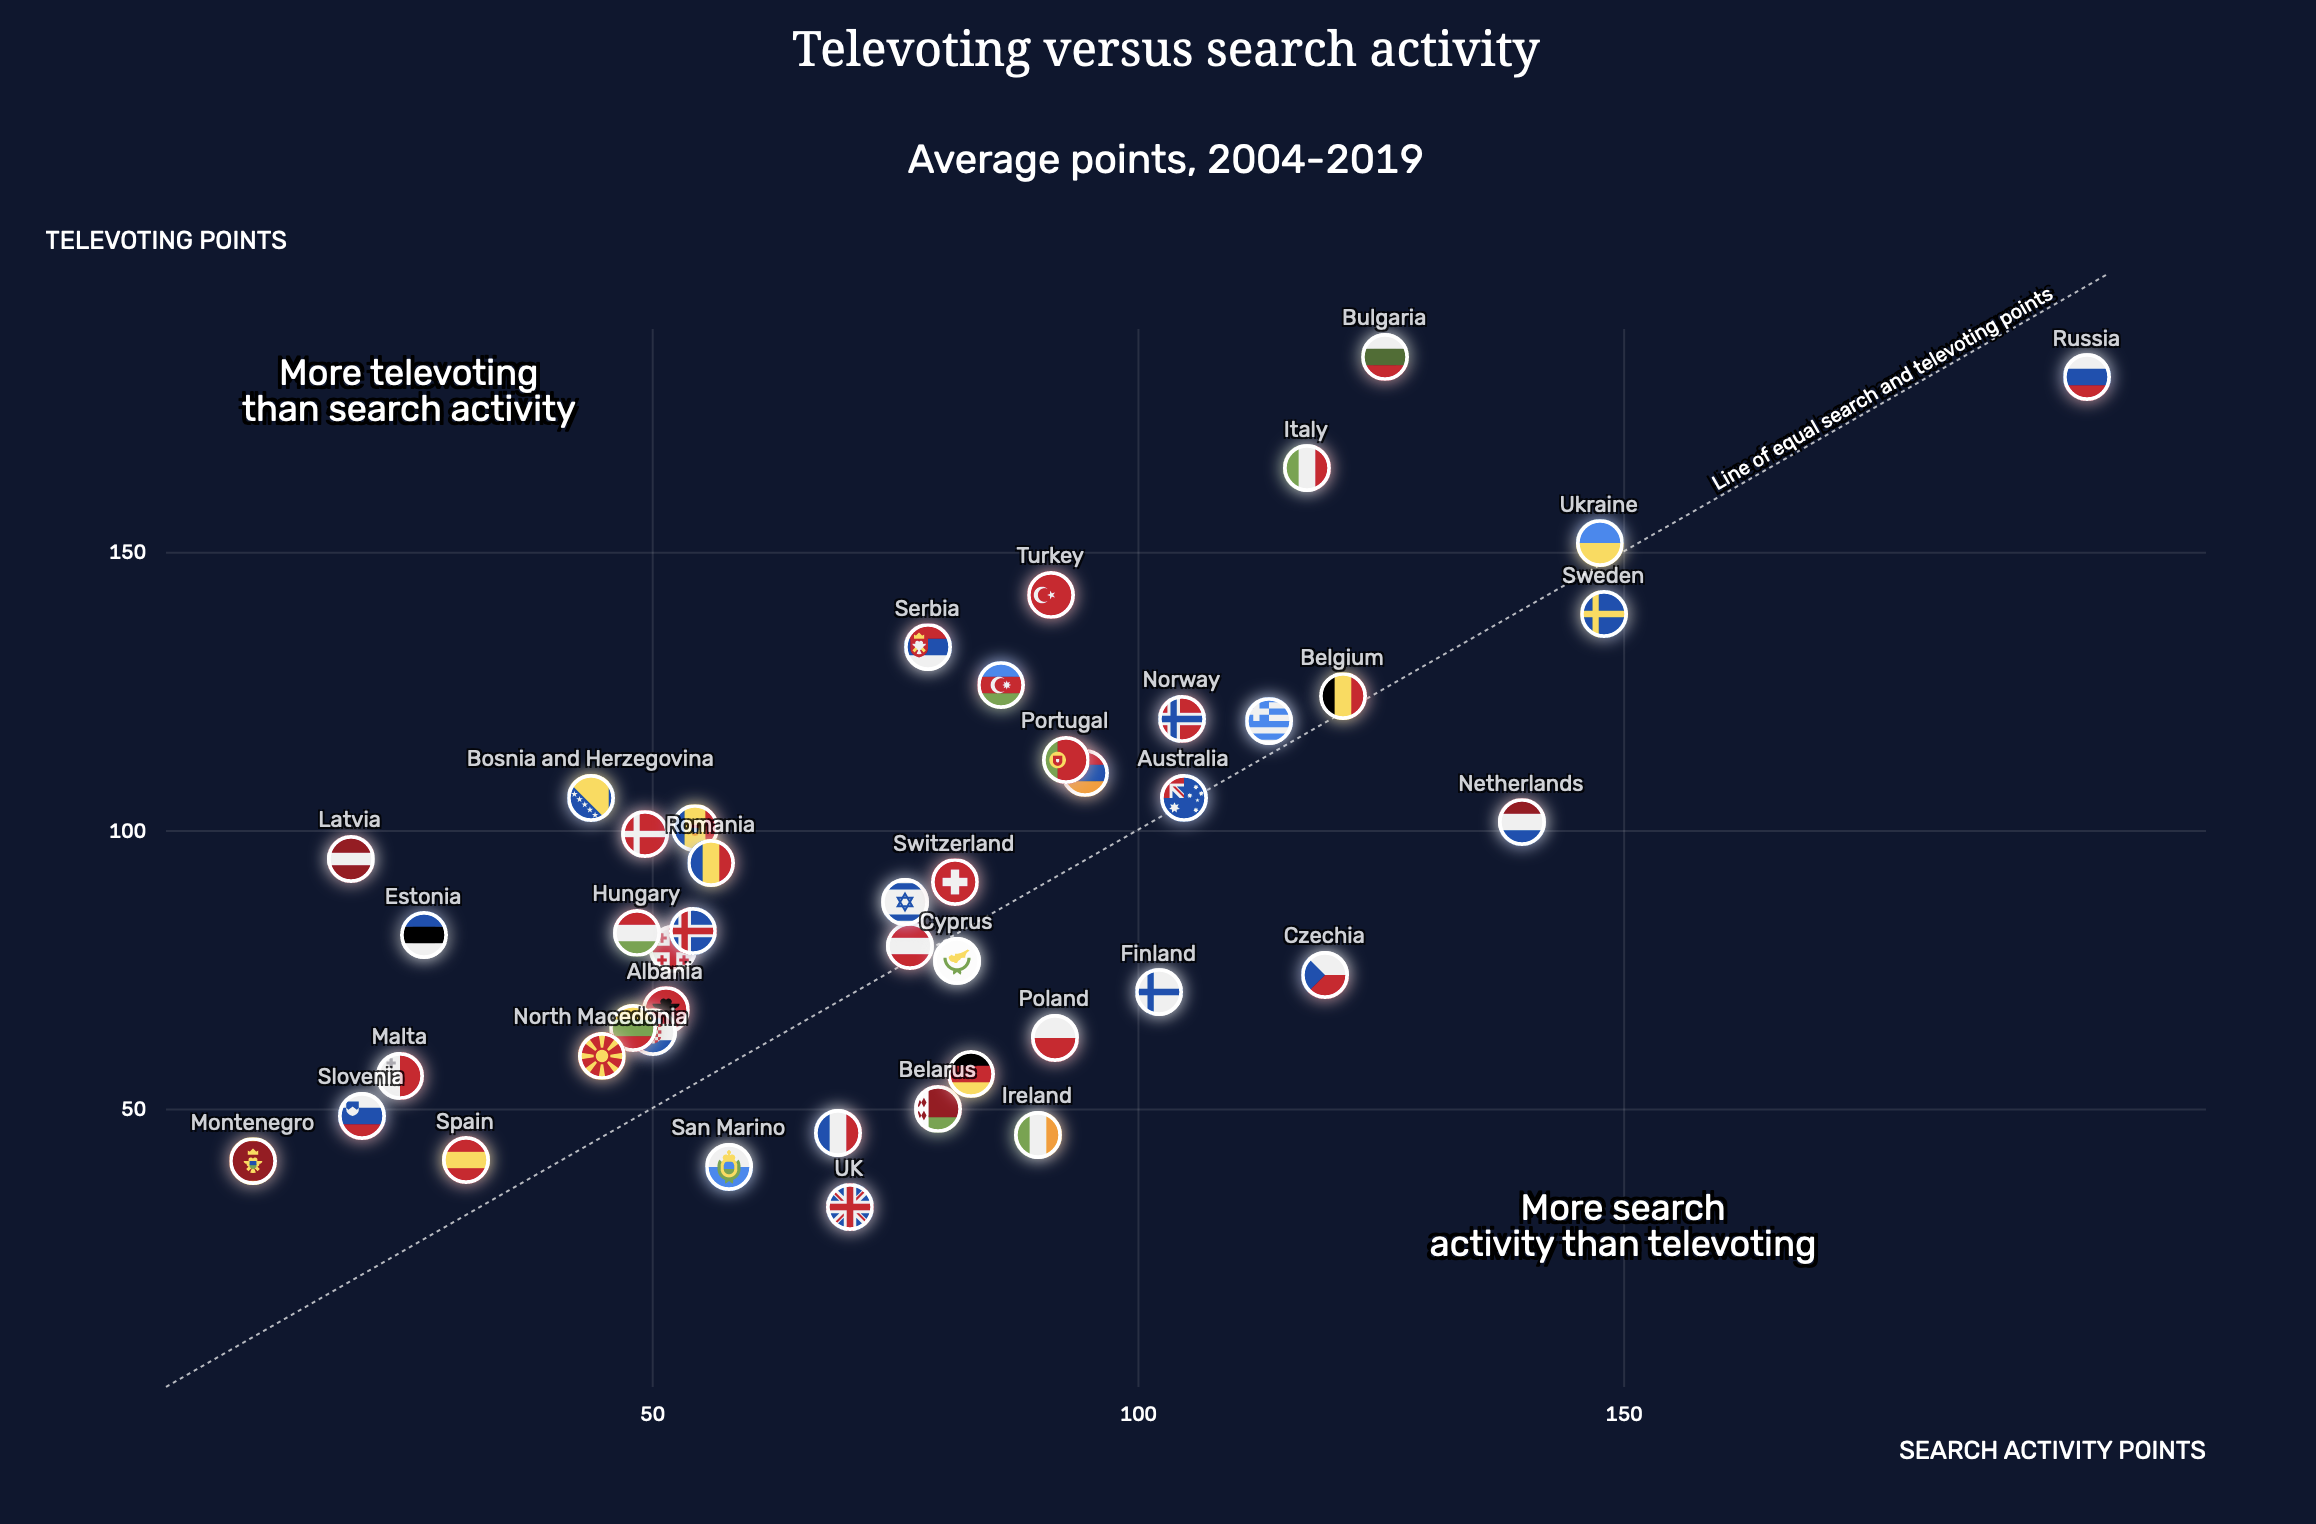
A visualisastion using country flags. Each flag is labelled with the country name, so people not familiar with country flags can also easily identify countries. Notice the diagonal dotted line, which is a visual annotation too (text annotations label the areas above and below this line, and the diagonal text explains the meaning of the line). Source: The Eurosearch Song Contest 2019, Maarten Lambrechts
Having redundancy in pictograms and text labels is always a good idea: icons and pictograms should be additional to text descriptions. Visual representations of features and concepts can be ambiguous, or your audience can be unfamiliar with the visual representation, with unrecognised or misunderstood icons as a result. On top of that, textual representation is also important for reasons of accessbility: these are used by assistive technology like screen readers for example.
![]()
This visualisation makes use of both numbers and icons for the x axis labels representing frequencies of elder people. Source: ‘The pandemic is gaining momentum’: Africa prepares for surge in infections, ft.com
A special case of using pictograms is the use of icons to represent people. This is a broad topic, that is covered by the page on anthropographics.