Plotting many observations or time series in a single visualisation can lead to overcrowded charts. One solution to this problem is to create what are called small multiples: little copies of the same chart, arranged in a grid, each containing a subset of the same data.
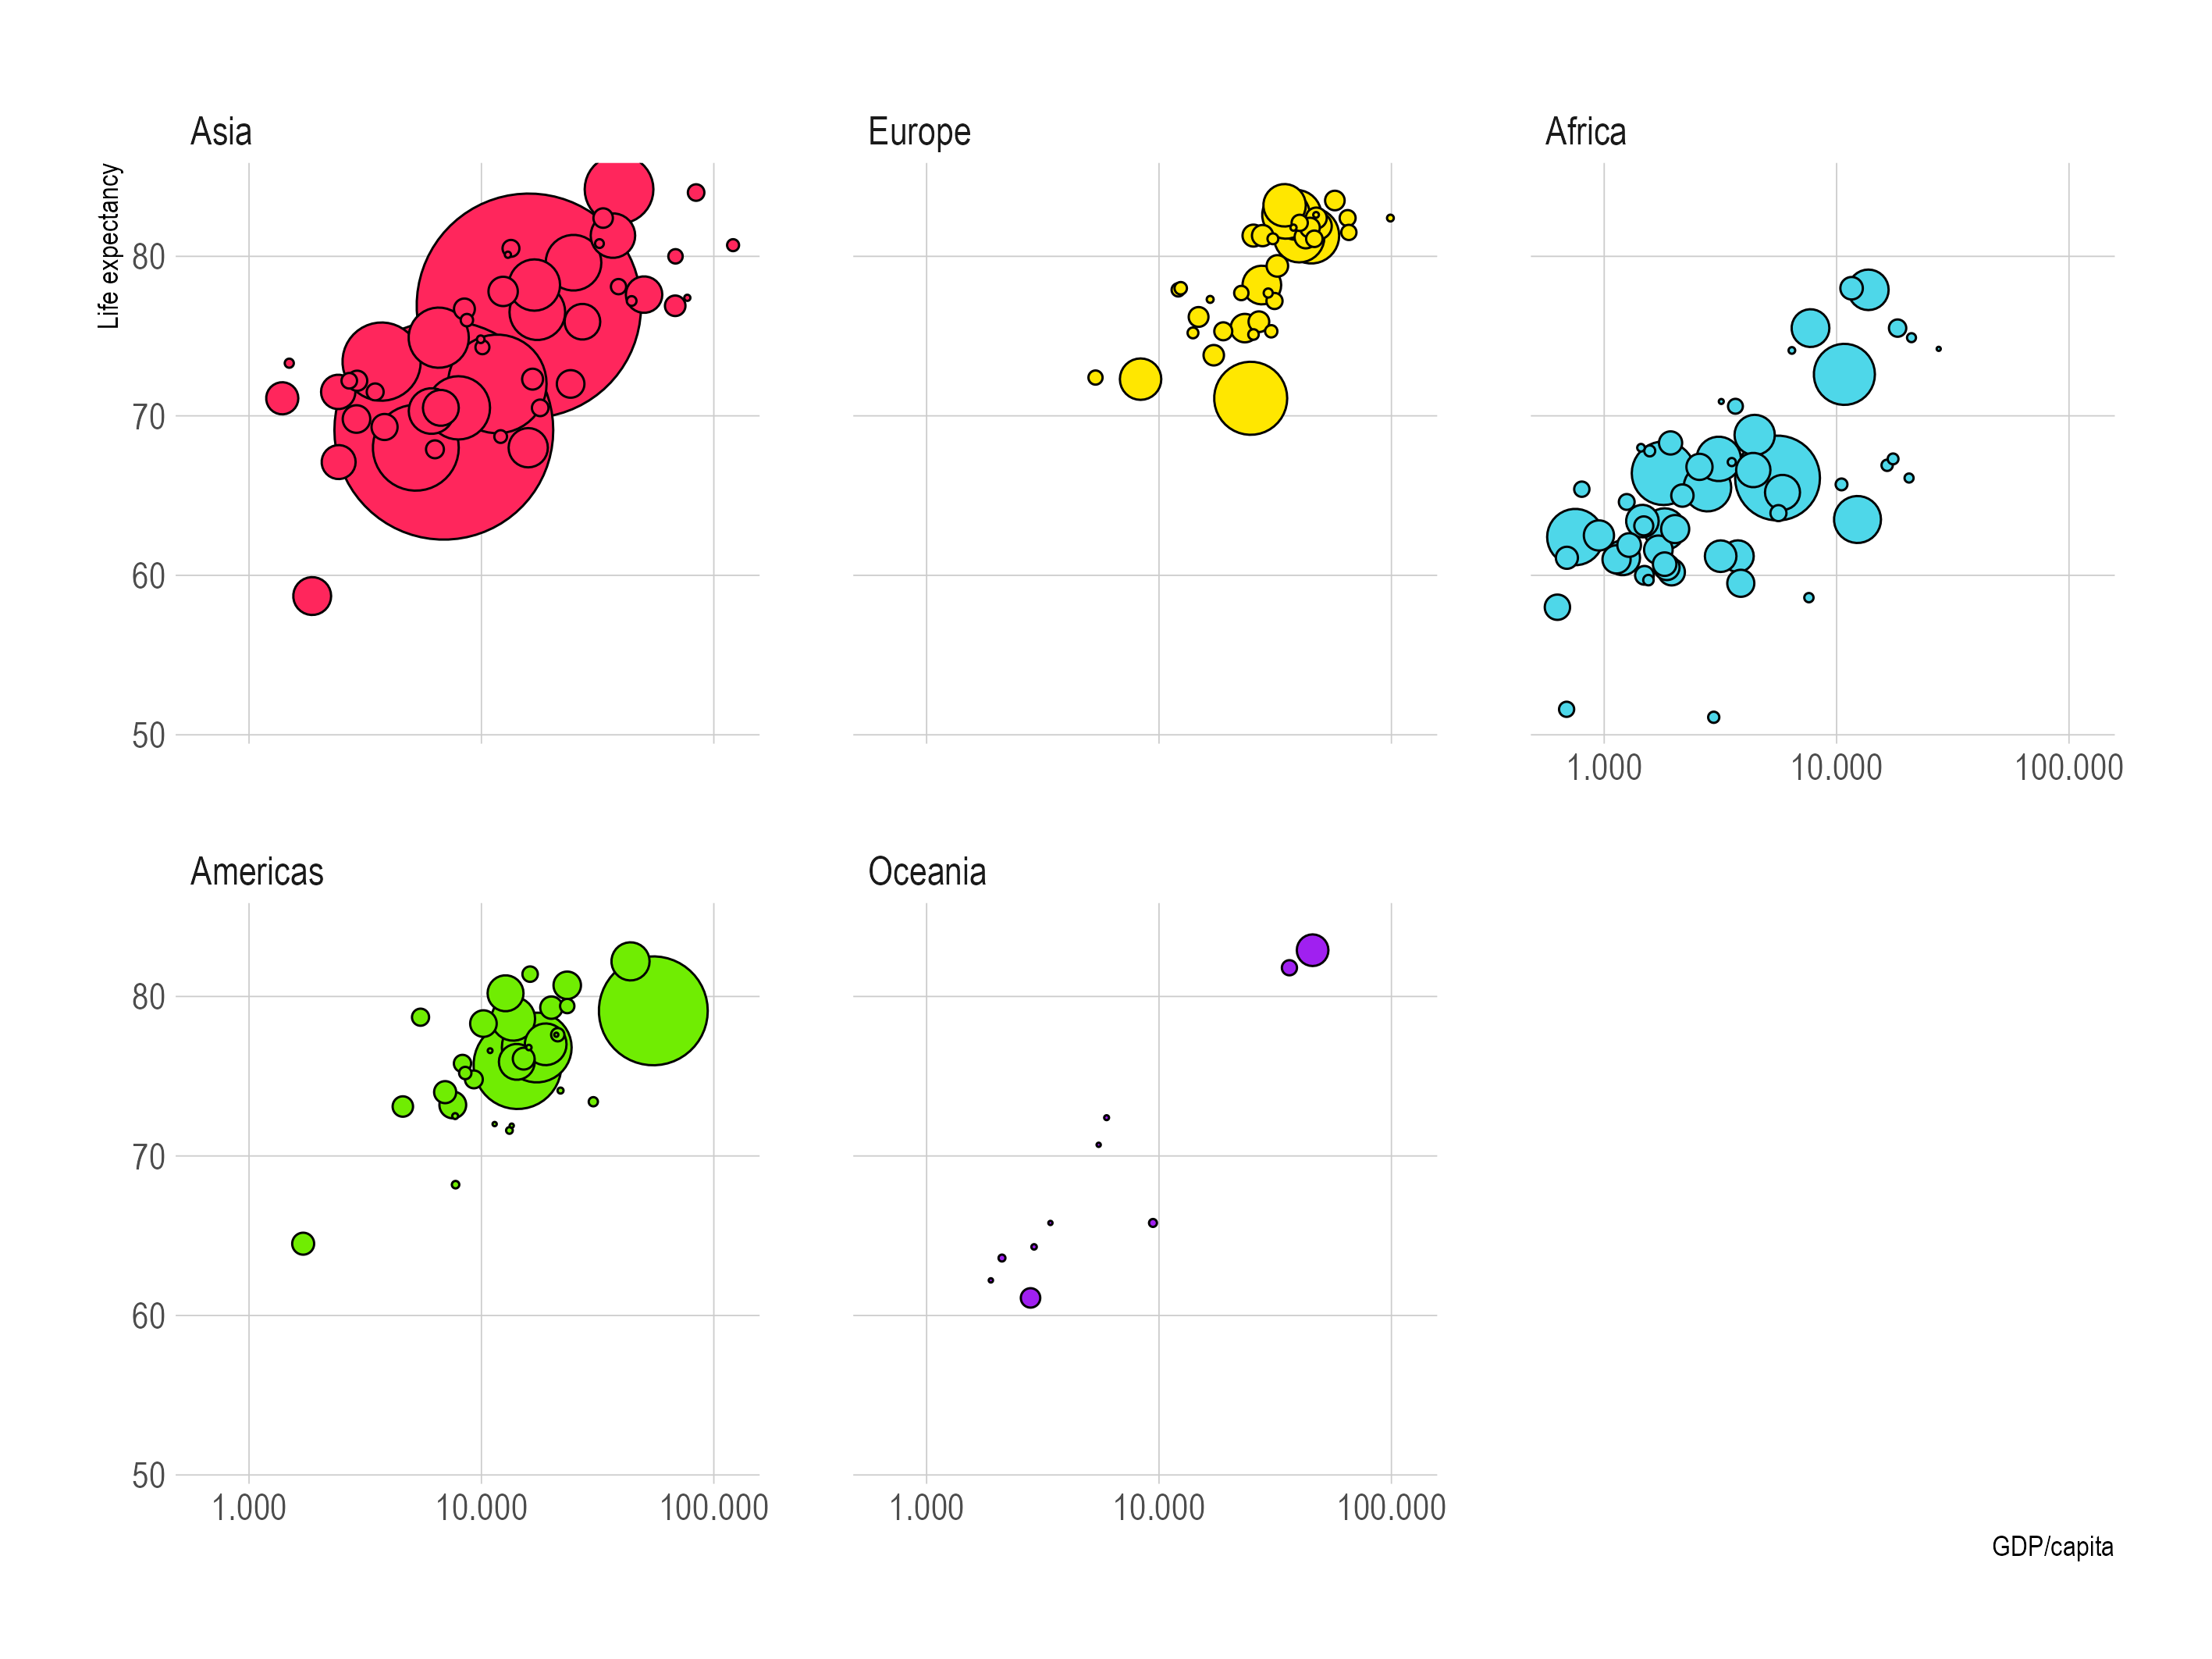
A small multiple version of the life expectancy versus GDP/capita bubble chart. Source: Maarten Lambrechts, CC BY SA 4.0
In the language of the Grammar of Graphics, small multiple charts are produced using faceting. In the example above, the continent variable is used to facet the plot, and as a result a small plot is created for each continent.
Faceting a plot can lead to a cleaner view on the data, and better comparisons between the values of the facet variable. Important for making comparisons between small multiples is that they share the same x and y scalesshare the same x and y scales. When this is not the case, like in the faceted plot below, comparisons are much harder to make.
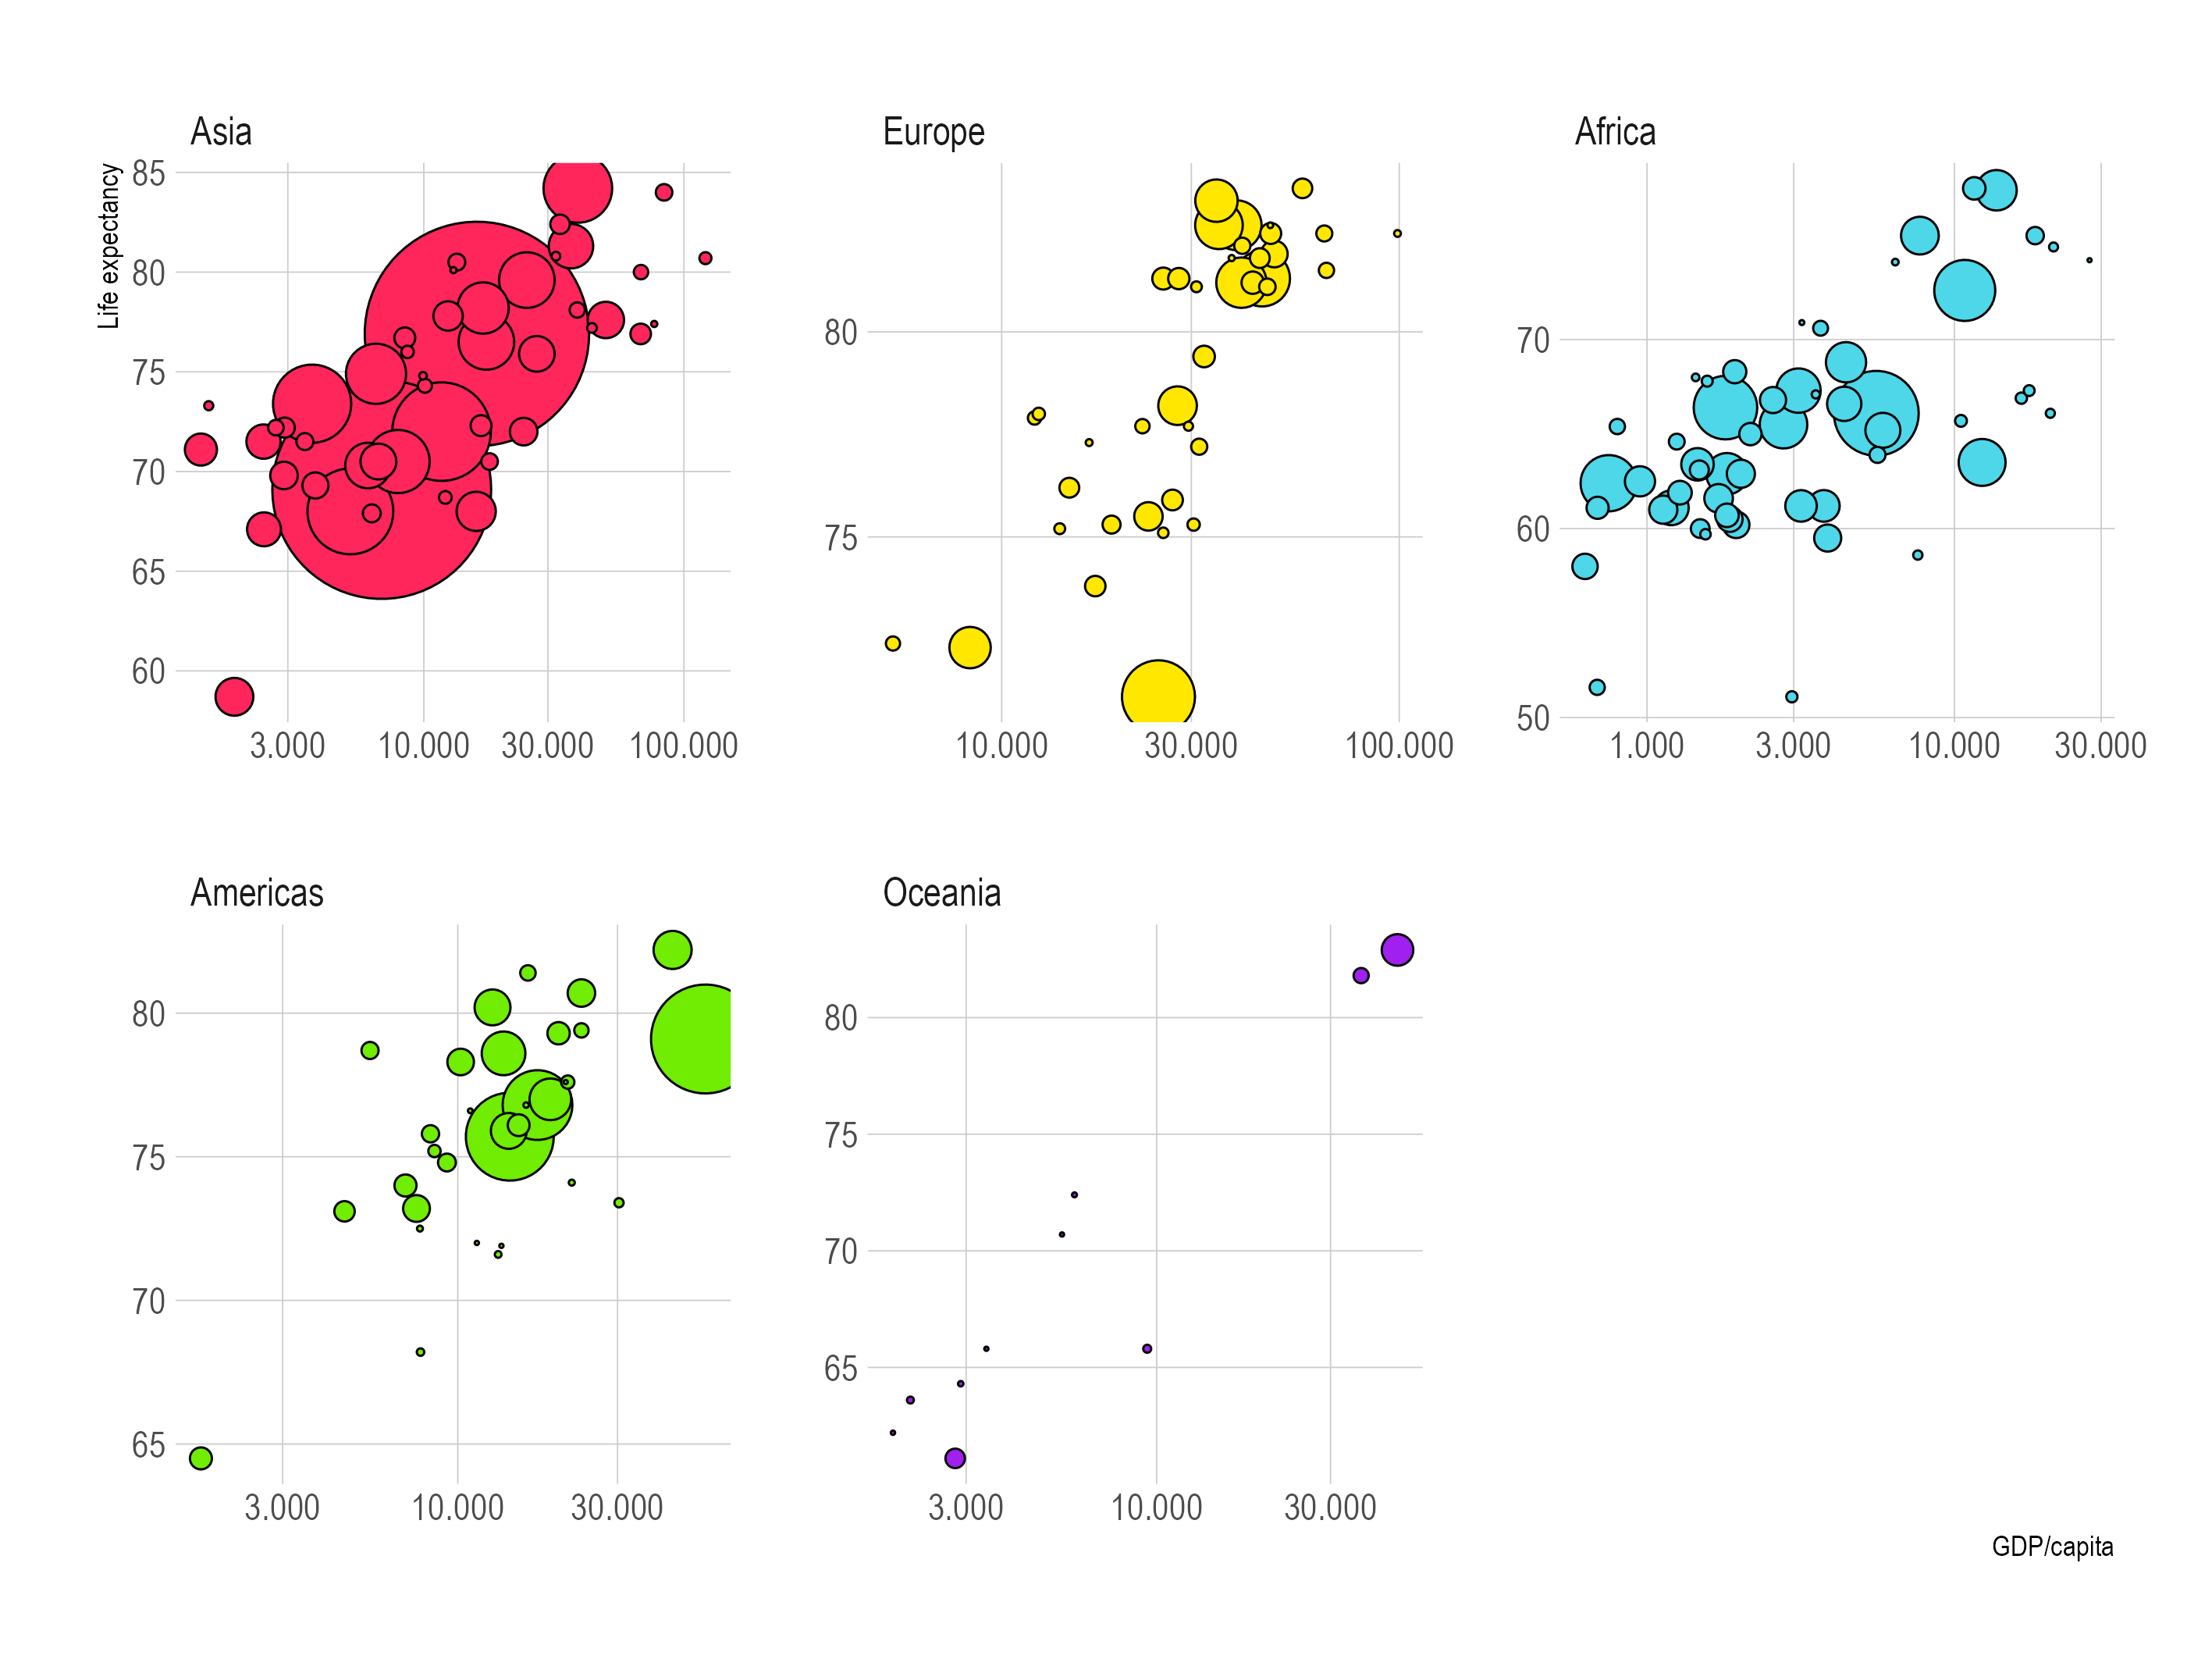
Check the y axis of all the small multiples. Source: Maarten Lambrechts, CC BY SA 4.0
Instead of a single facet variable, a plot can also be facetted using 2 variables. In that case, the small multiples are arranged in a grid in which the columns represent the values of the first variable, and the rows the values of the second variable.
In the plot below a data set containing body measurements on penguins is plotted as a scatter plot that maps culmen length to y and and culmen depth to x. The plot is facetted by the sex (columns) and by the species (rows) of the penguins.
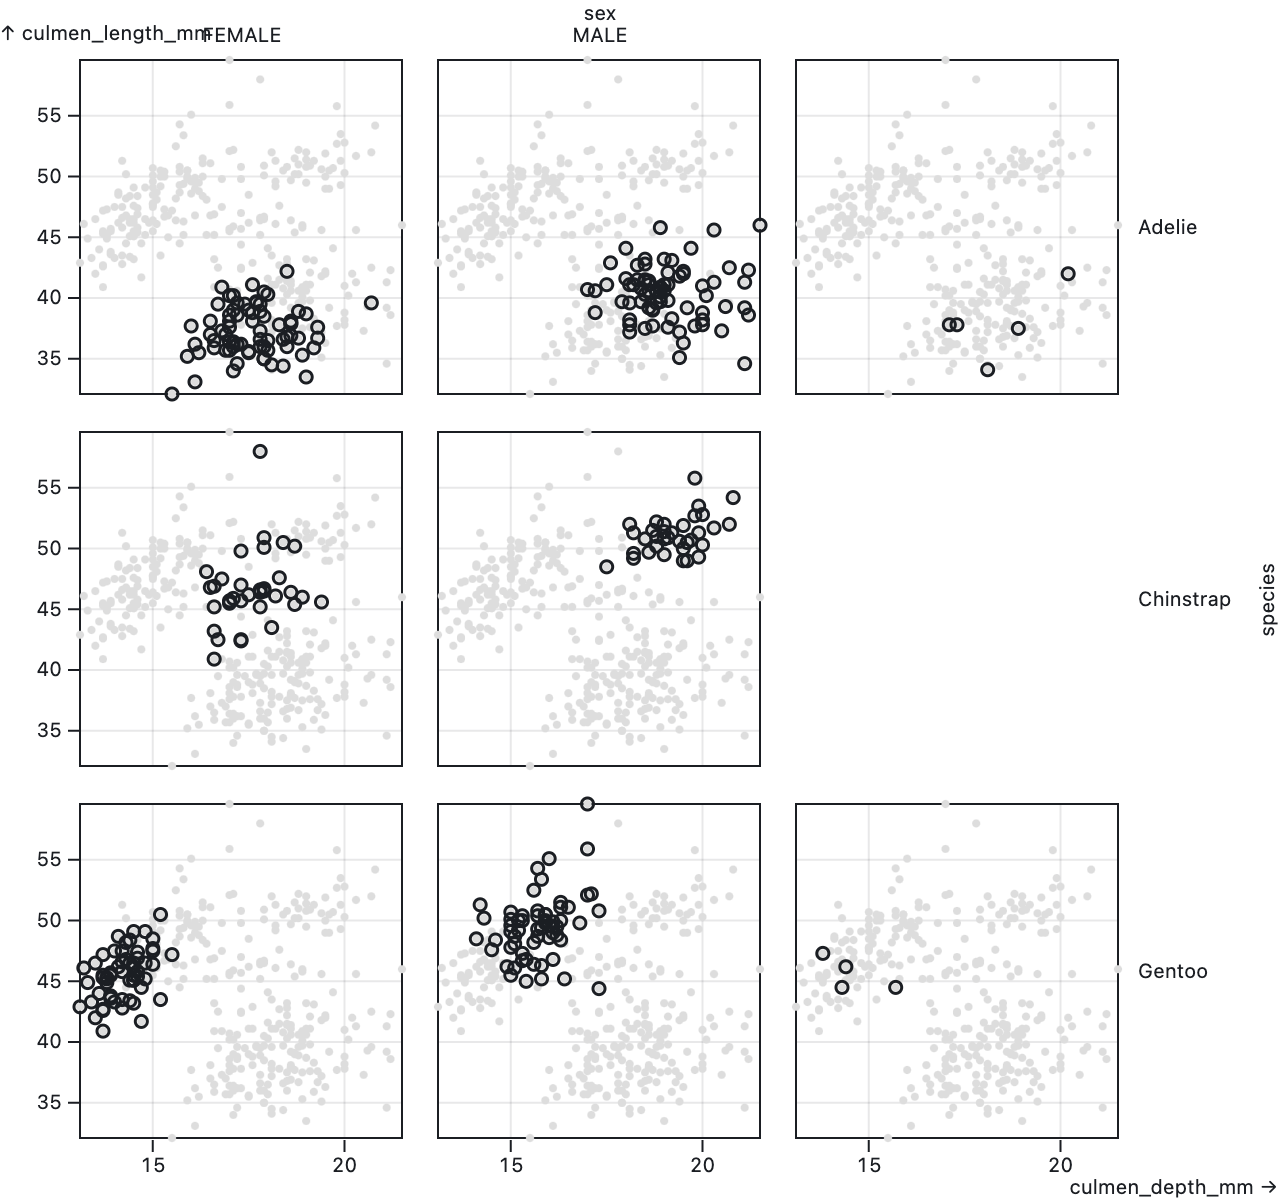
Source: observablehq.com/@observablehq/plot-facets
On a side note: if you are wondering what a penguin’s culmen is, check the image below.
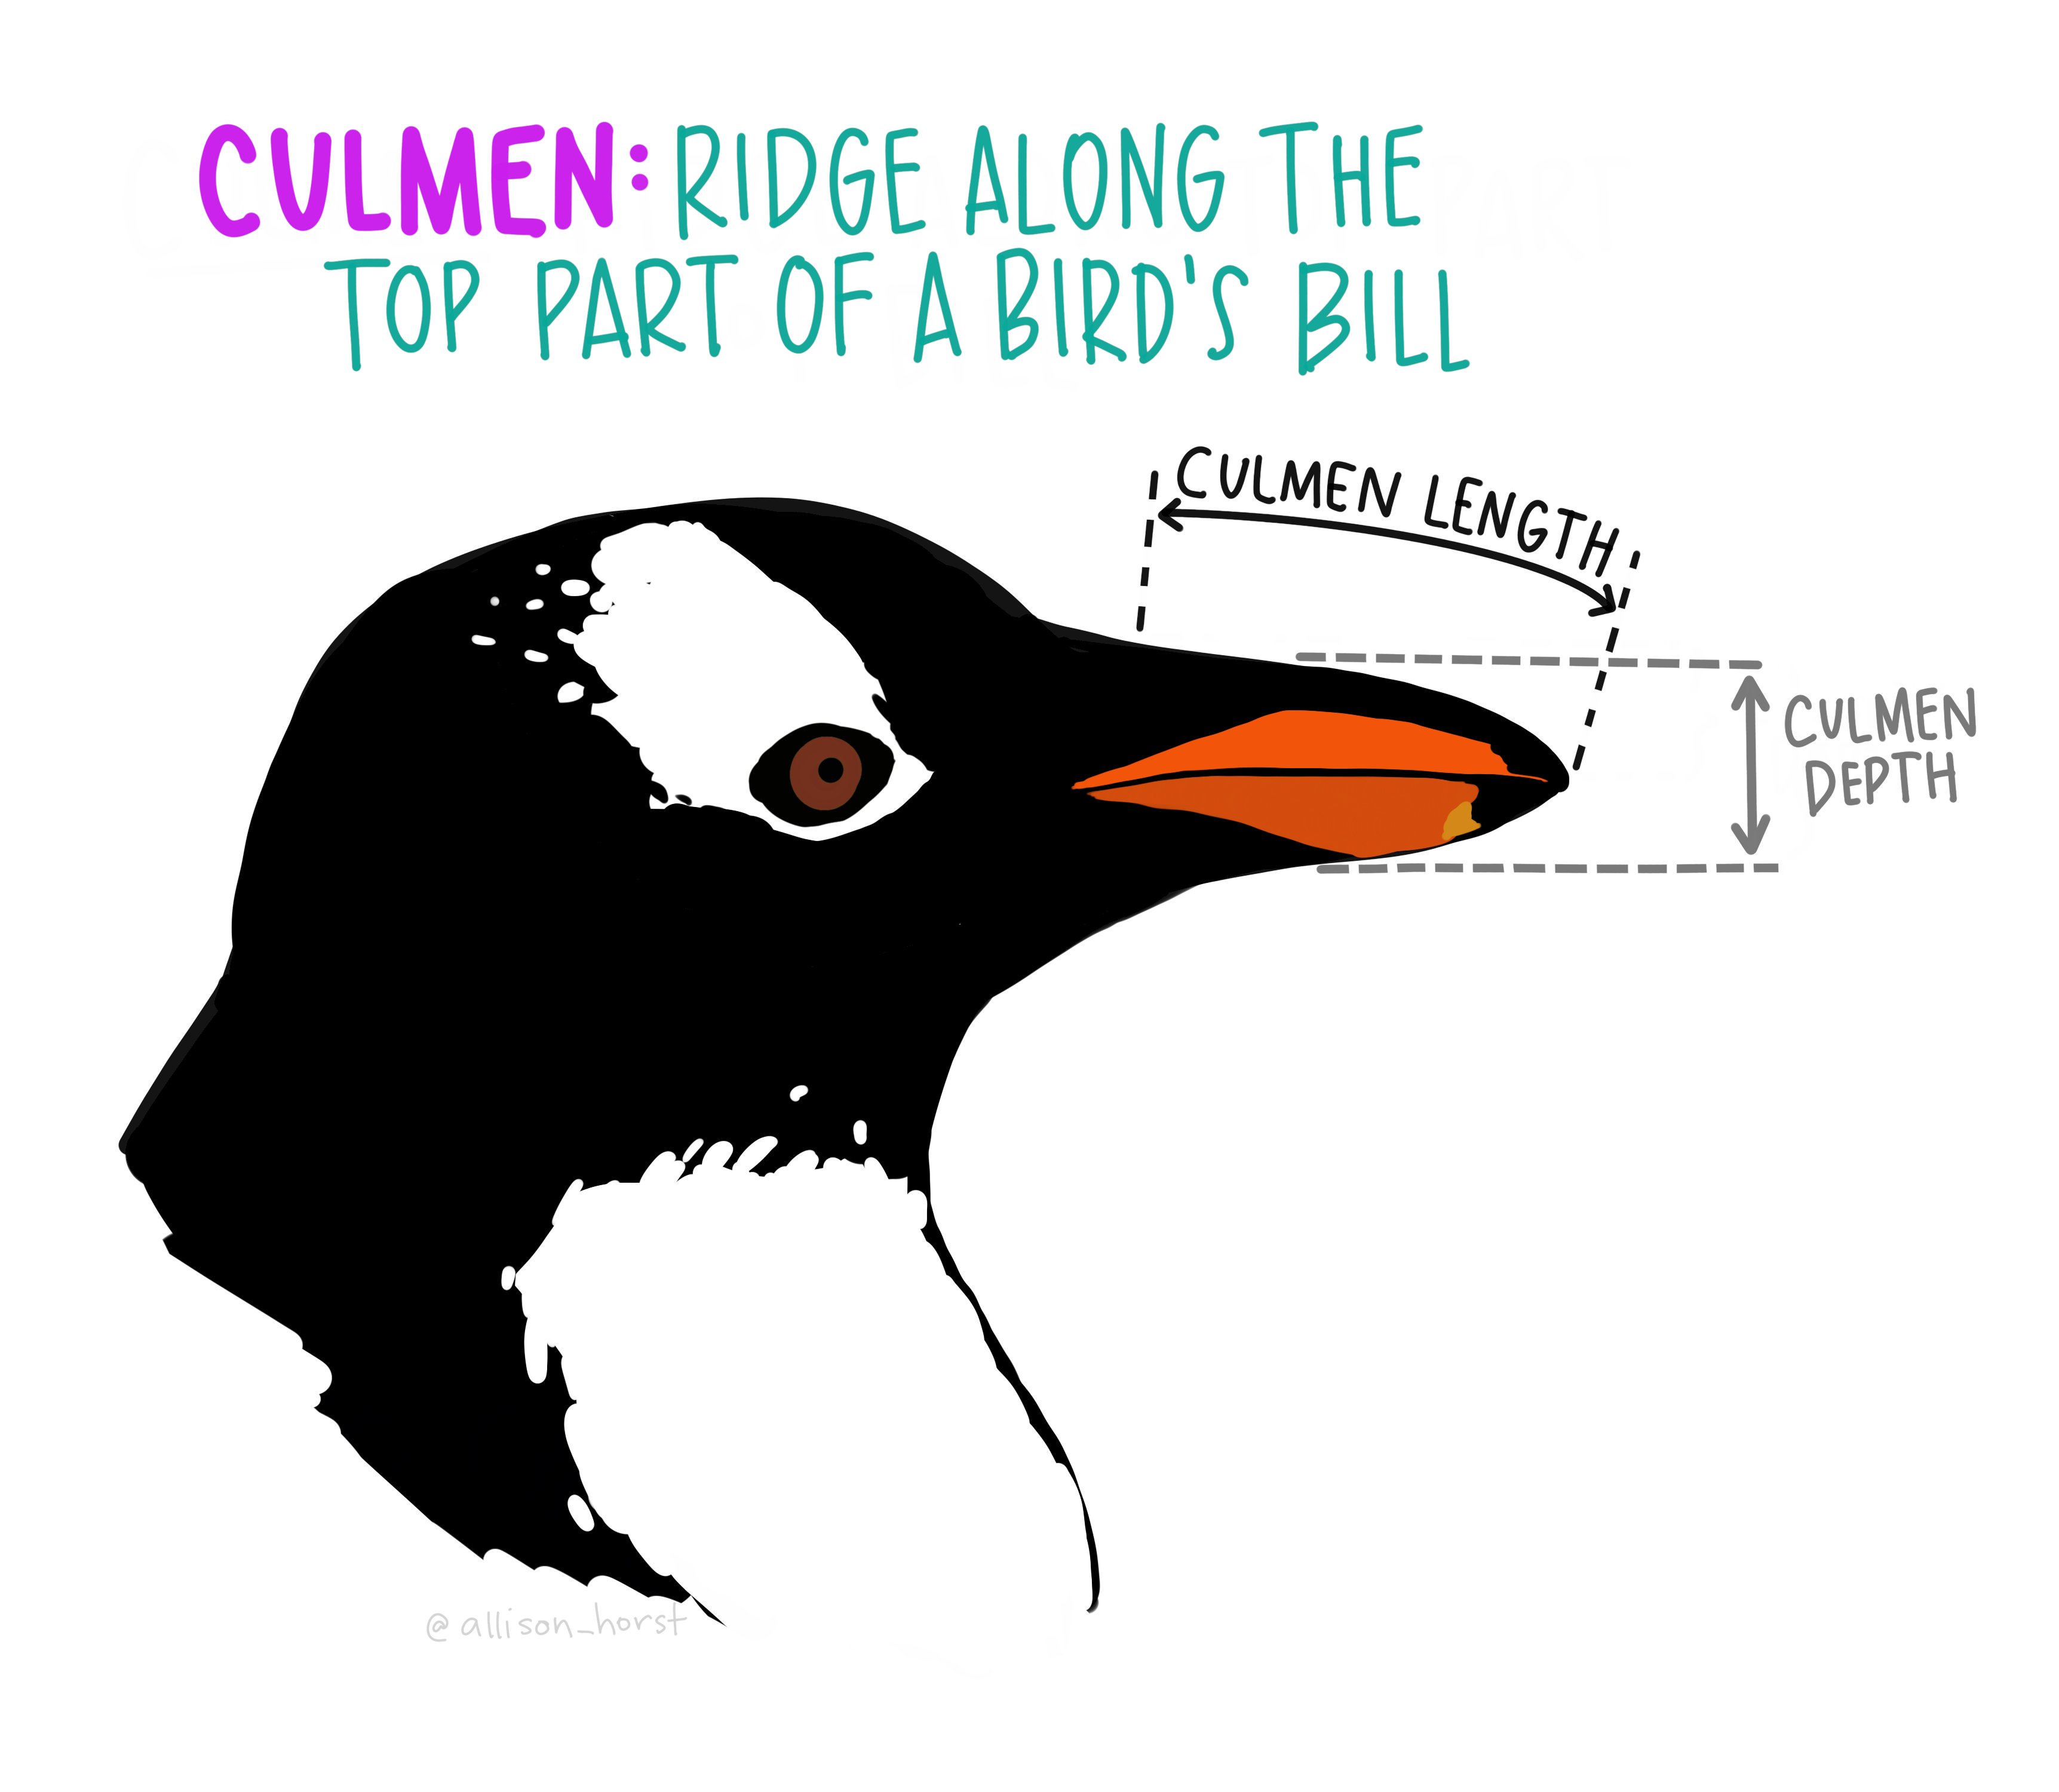
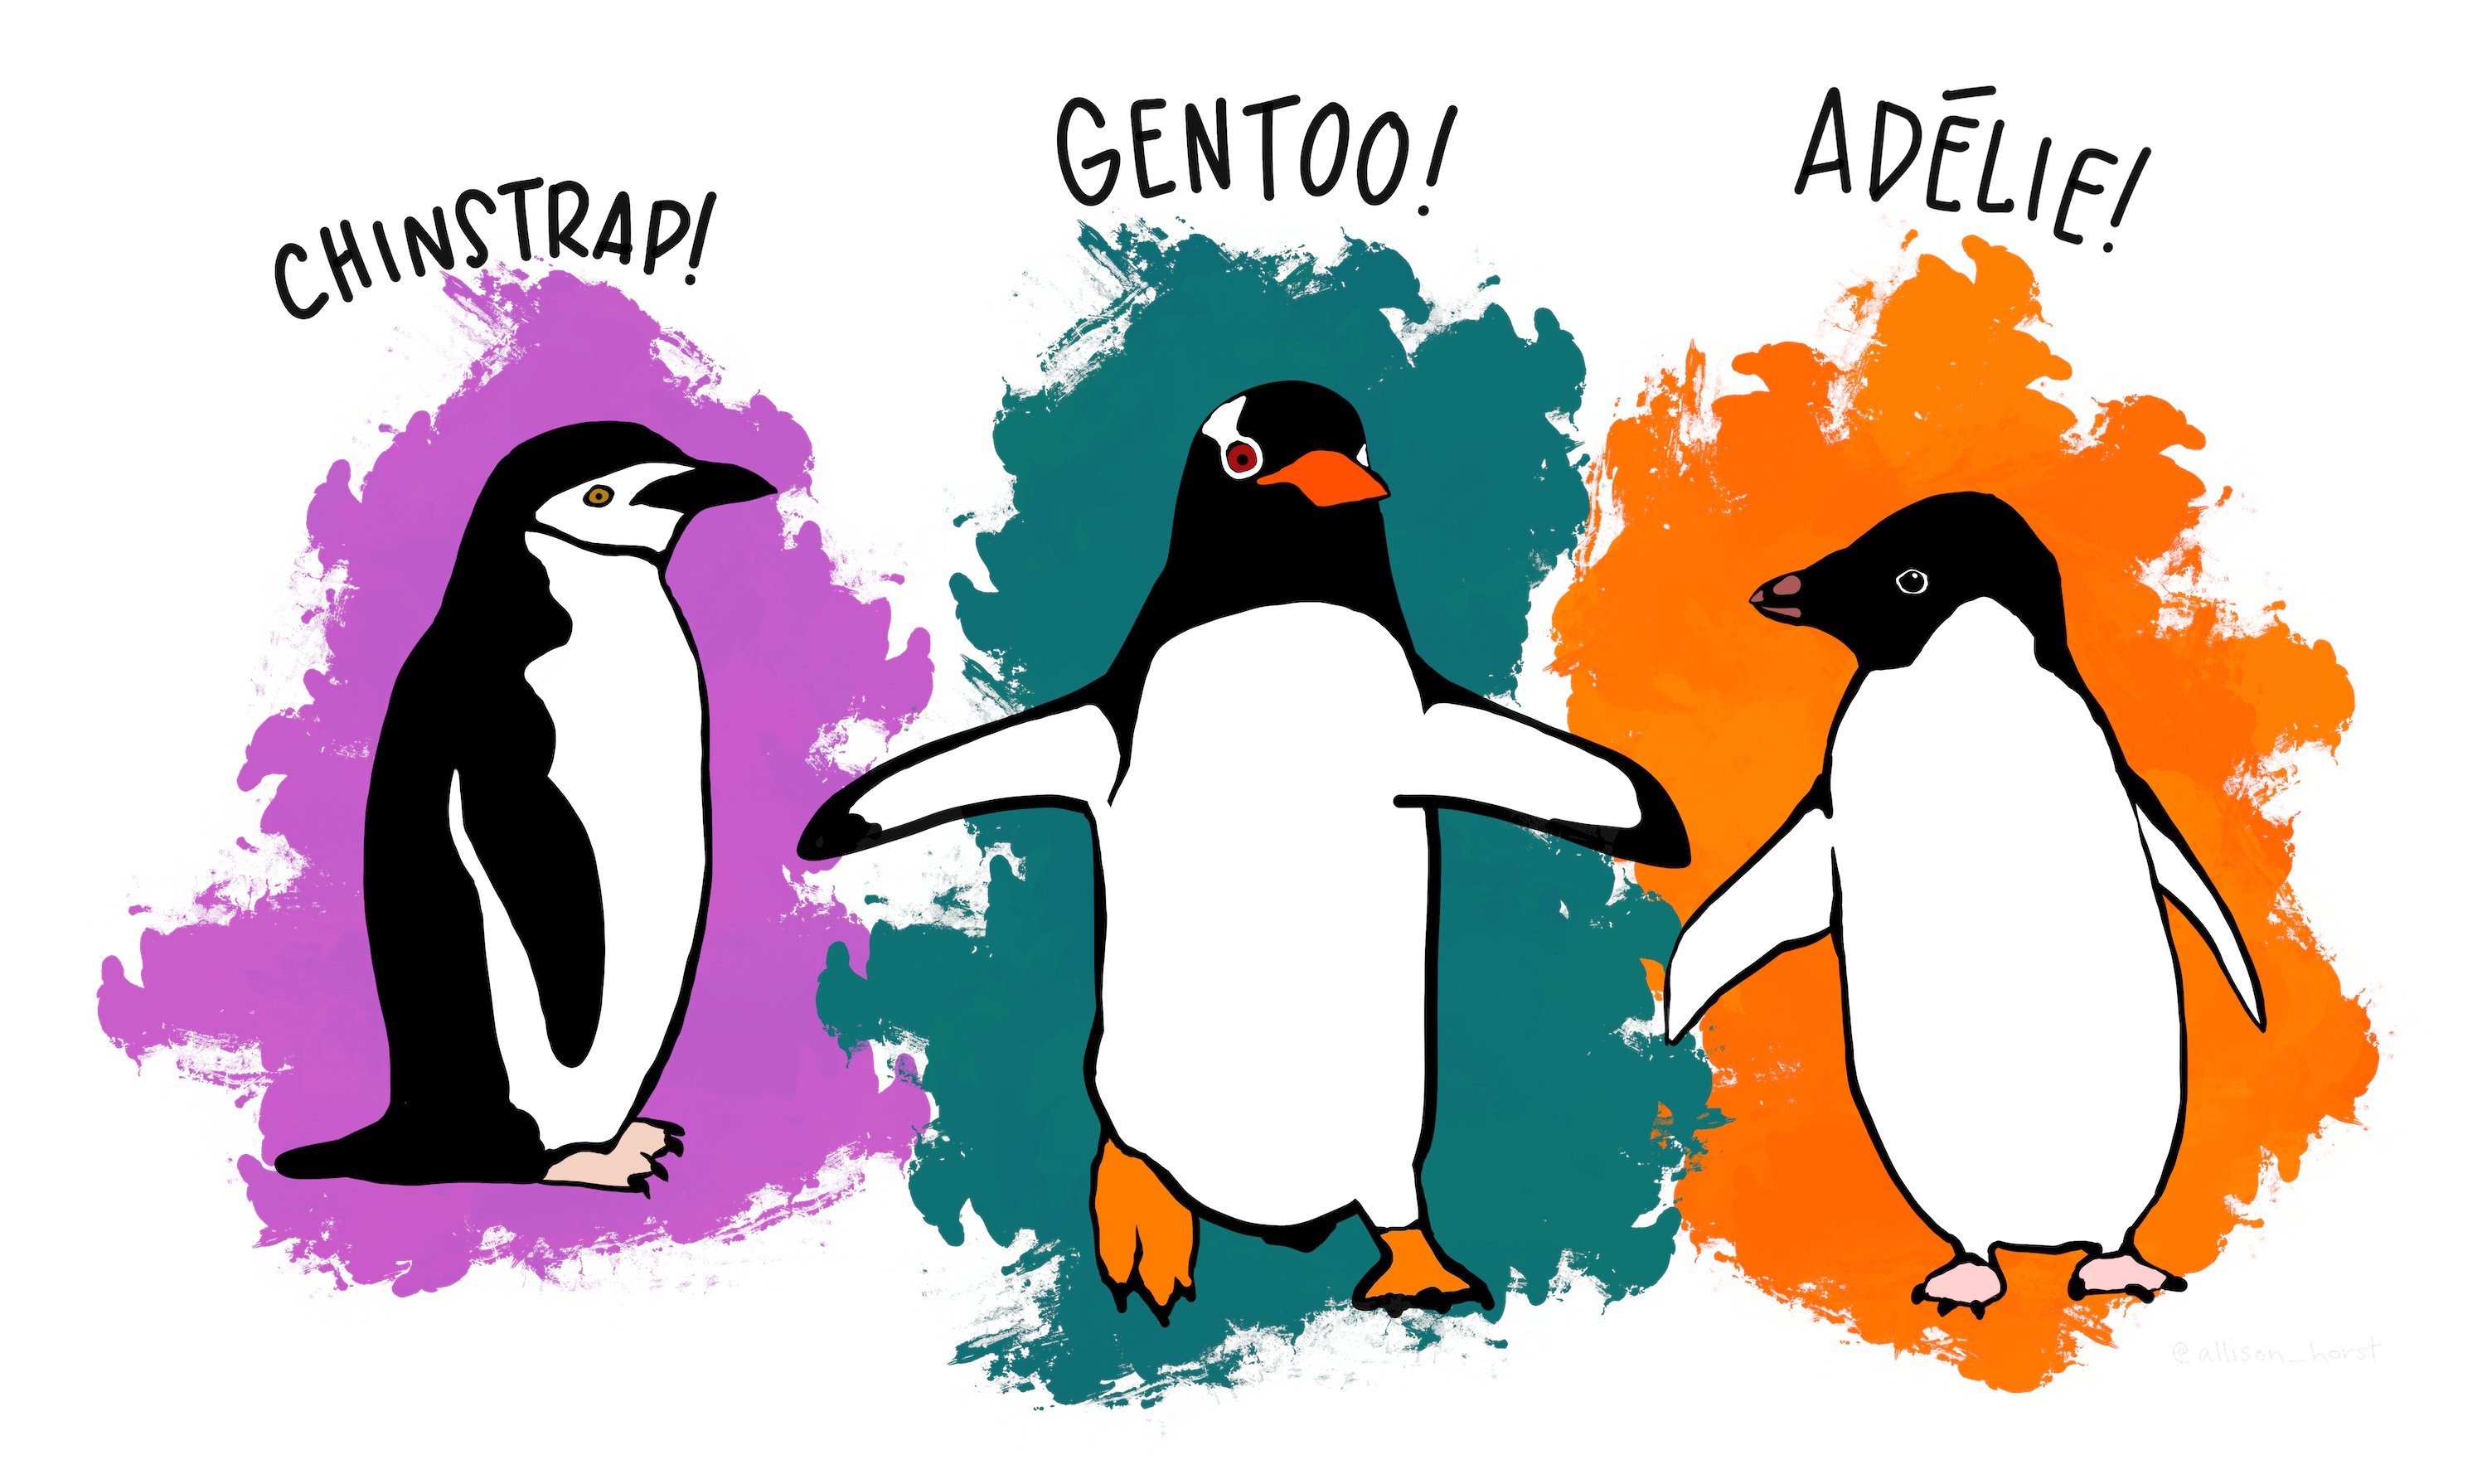
Source: Allison Horst