Scales encode variables into visual properties. But in order to read a visualisation, the viewer needs to be able to do the the reverse and decode the visual properties back into variable values. This means that users should be able to read data values from a plot. The chart elements that make this possible are called **guides**.
Guides can be looked at as the visual representation of scales. Scales on their own are just abstract functions that return values in the output range based on values of the input domain. Guides make this functionality of scales visible, and let the viewer perform the decoding of the values. So, all the representations of scales you saw in the previous section in this module… are actually guides.
For the x and y position aesthetics, guides are axes. On an axis, the values that are marked are called ticks. Ticks have tick labels: the text elements showing the tick values. They can also have small tick marks, or a grid line spanning the whole chart.

An x axis with 11 ticks representing a linear scale with an input domein of [0, 100]. Source: observablehq.com/@observablehq/plot-scales
For all other aesthetics, the guide is a legend. Probably the most common legends are colour legends. They help the viewer distinguish between categories and time series in a visualisation.
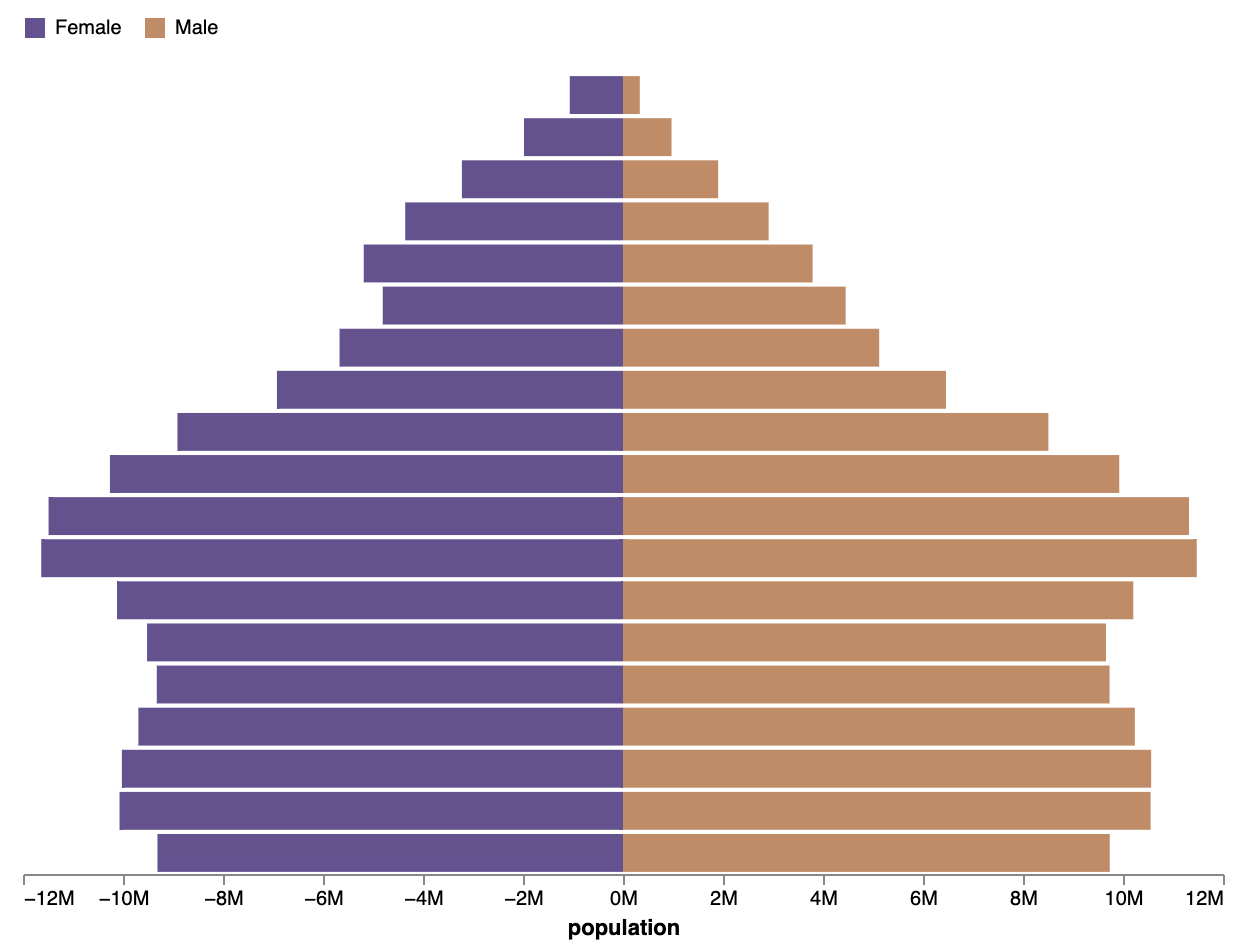
In this visualisation, the legend in the top left is the key for the reader to know which bar fill colour represents the male and female population in each age category (which is encoded in the y aesthetic). Source: vega.github.io/vega-lite/examples/bar_diverging_stack_population_pyramid.html
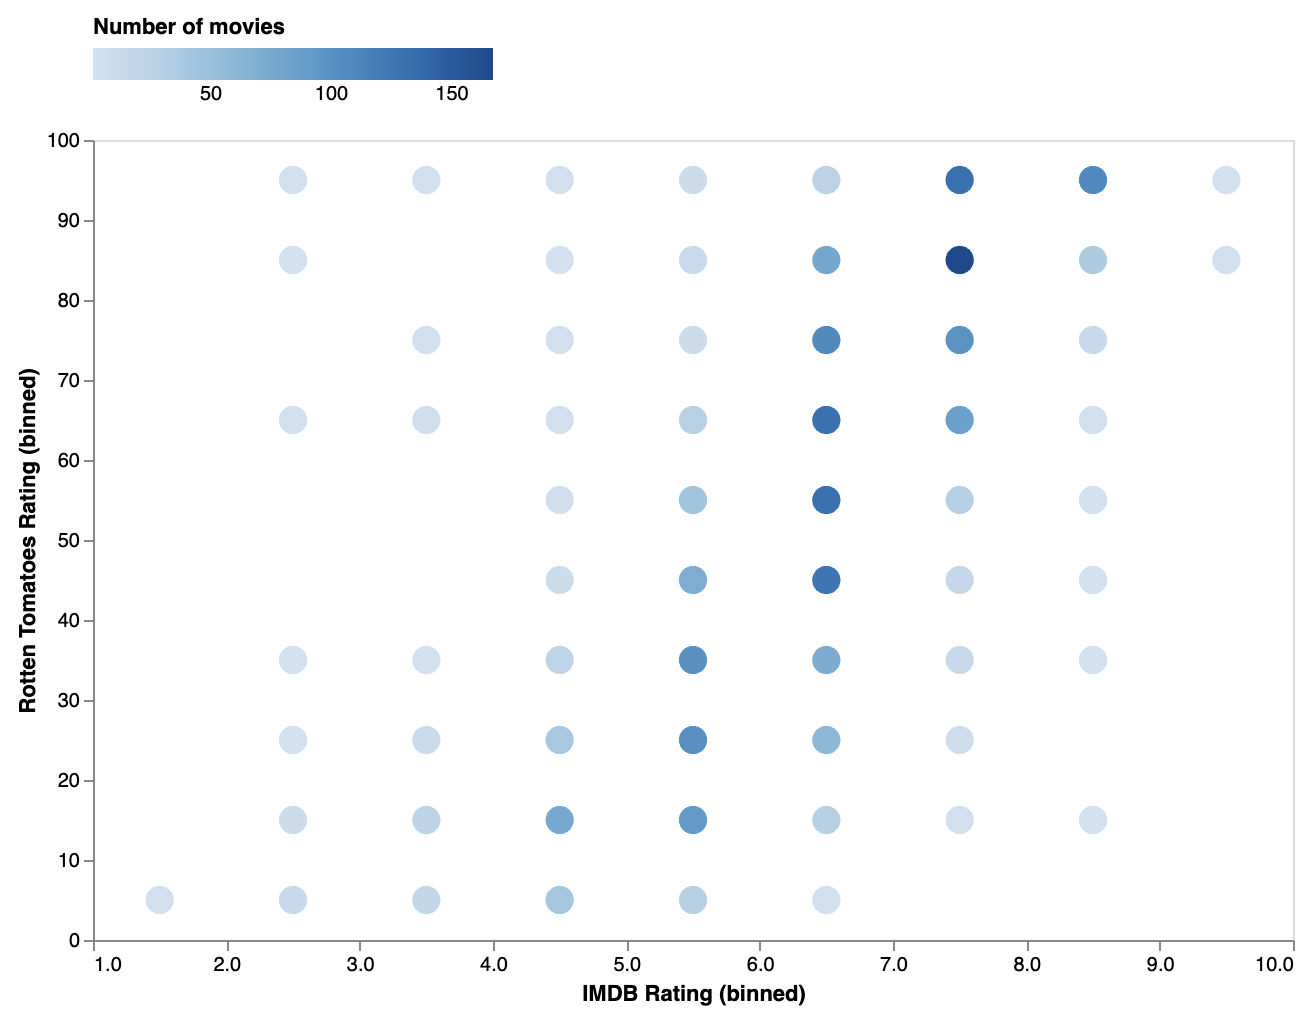
When a continuous variable is binned, the colour legend can show the number of bins and their boundaries.
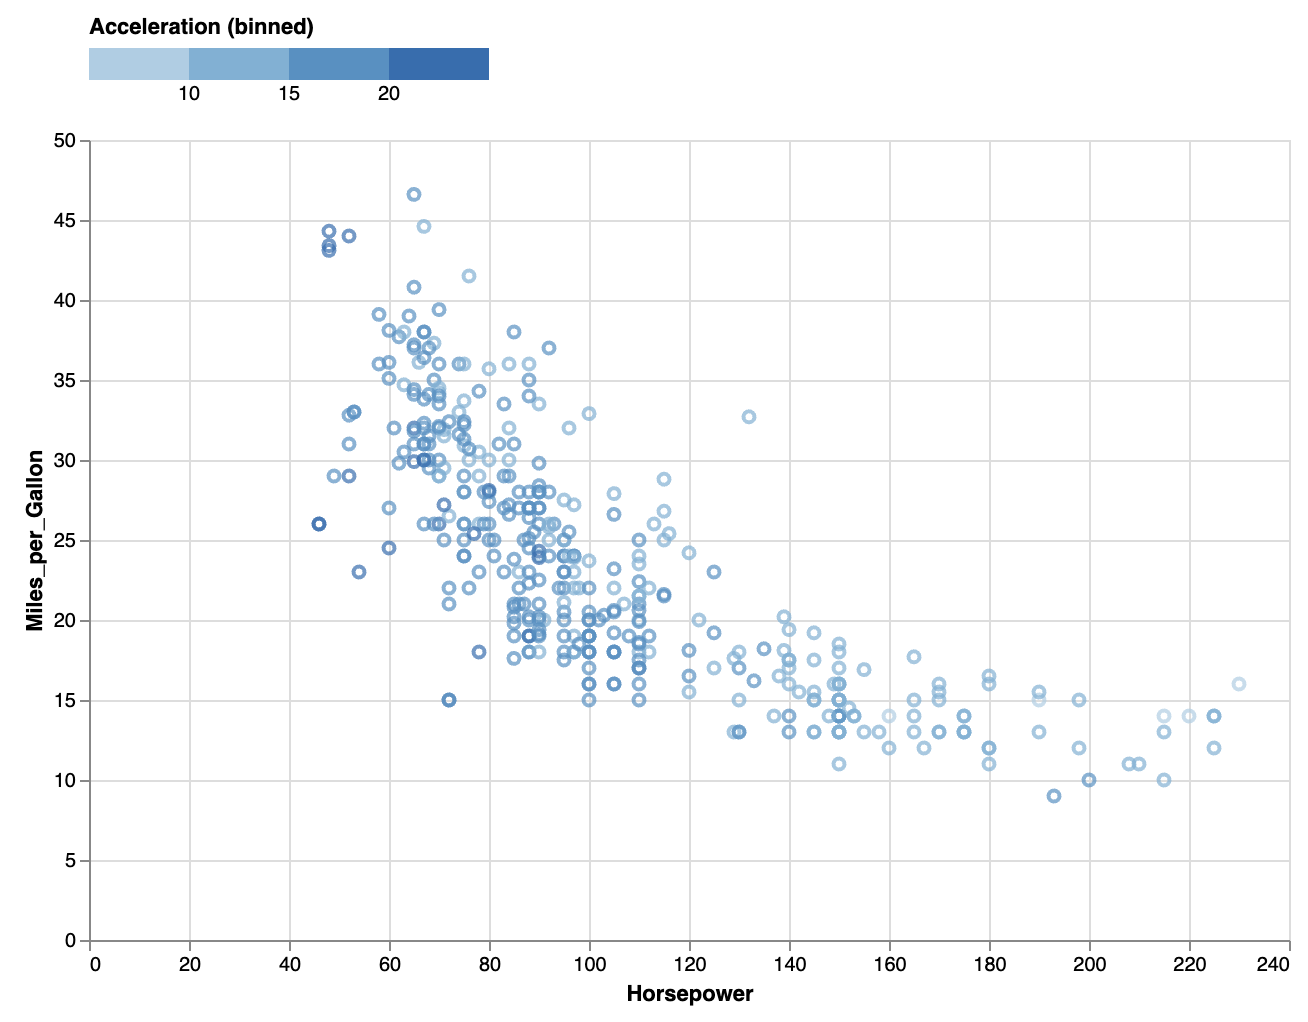
Source: vega.github.io/vega-lite/docs/bin.html
When a continuous variable is mapped to colour without binning, the resulting legend is a colour gradient.
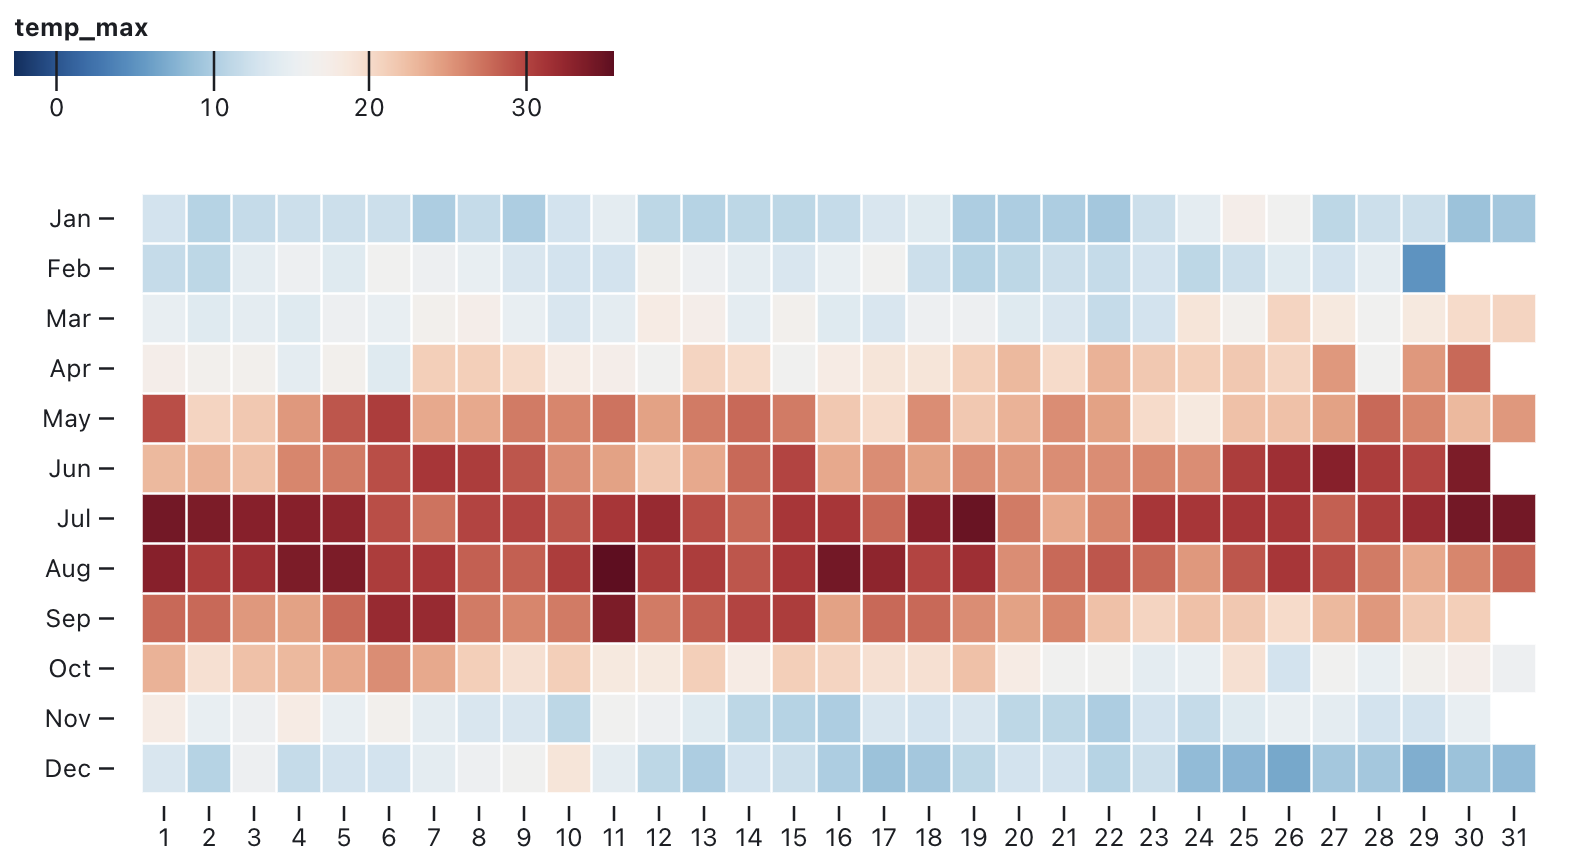
Source: observablehq.com/@observablehq/plot-legends
When a categorical variable is mapped to the shape aesthetic, a plot needs a shape legend to let the user decode the chart.
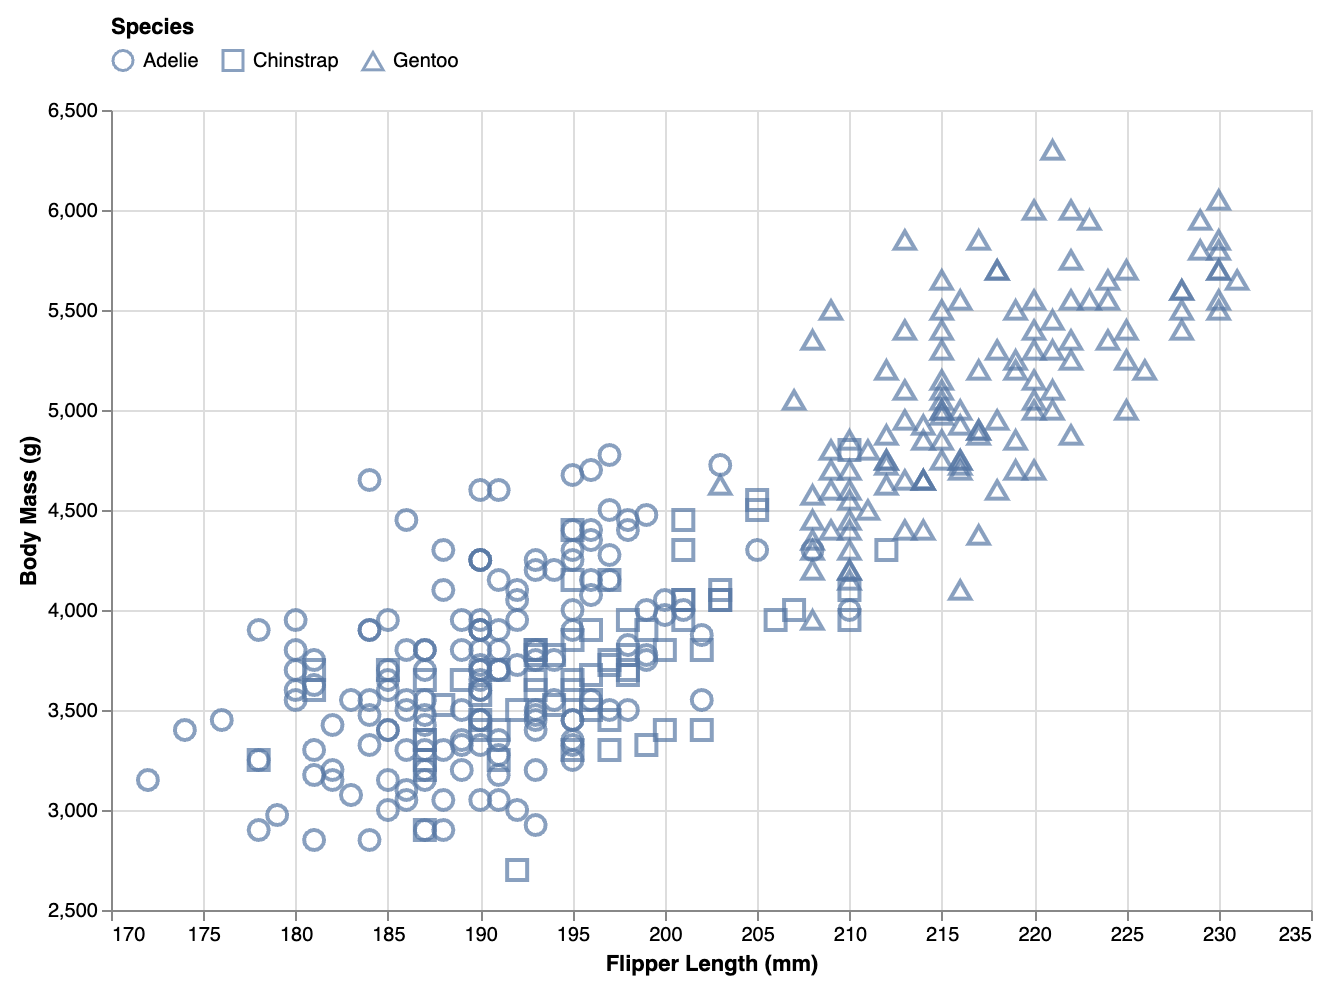
Source: vega.github.io/vega-lite/docs/legend.html
When a variable is double encoded and mapped to the shape and colour aesthetics simultainuously, the legends for both aesthetics can be combined.
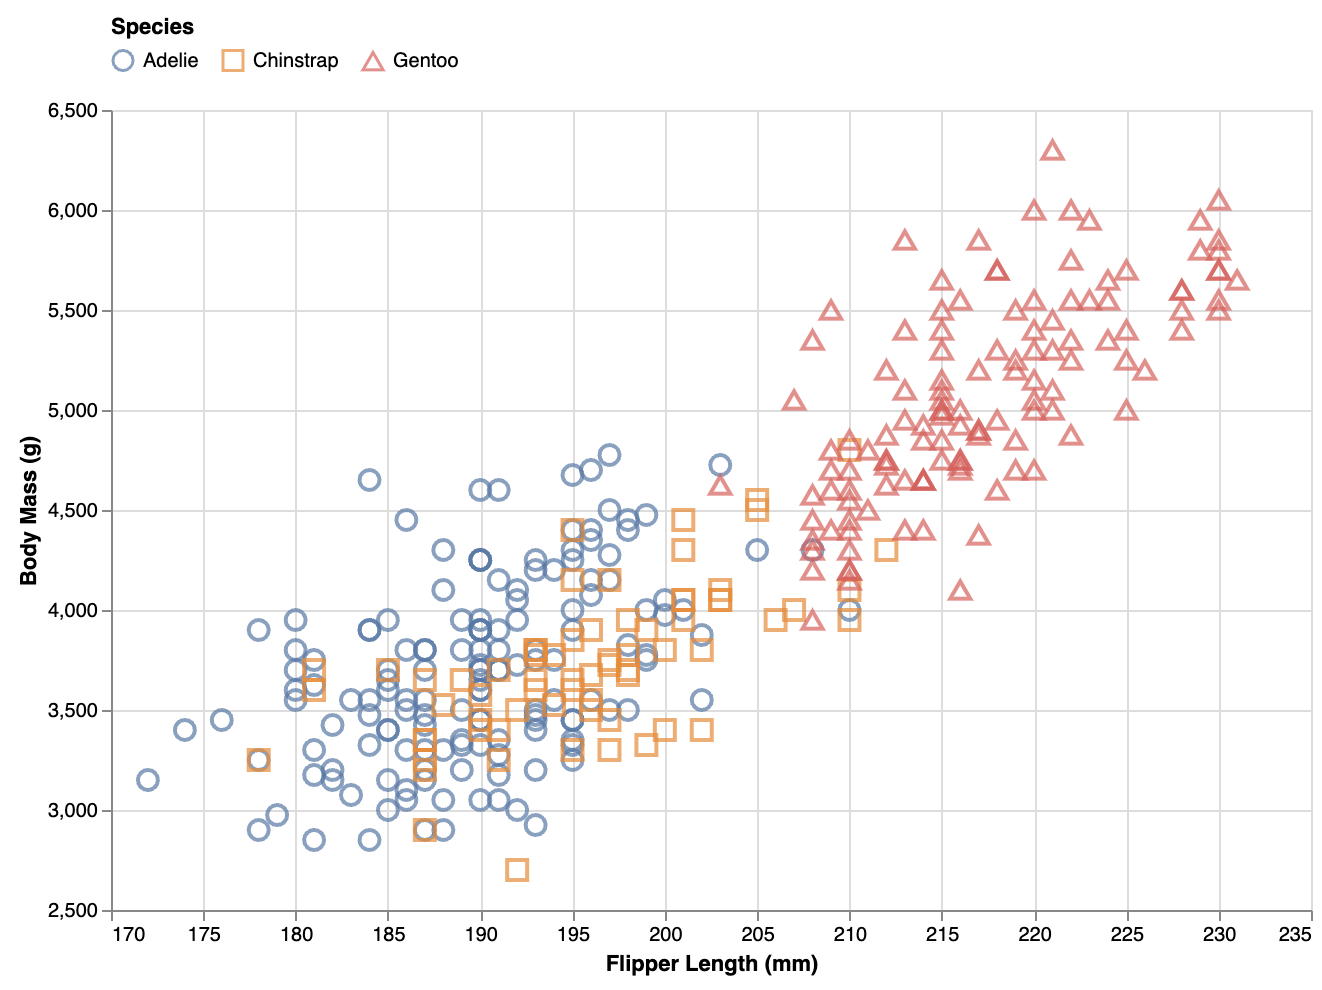
Source: vega.github.io/vega-lite/docs/legend.html
A size legend uses scaled legend symbols to let viewers estimate the values the different sizes of the used geometry represent.
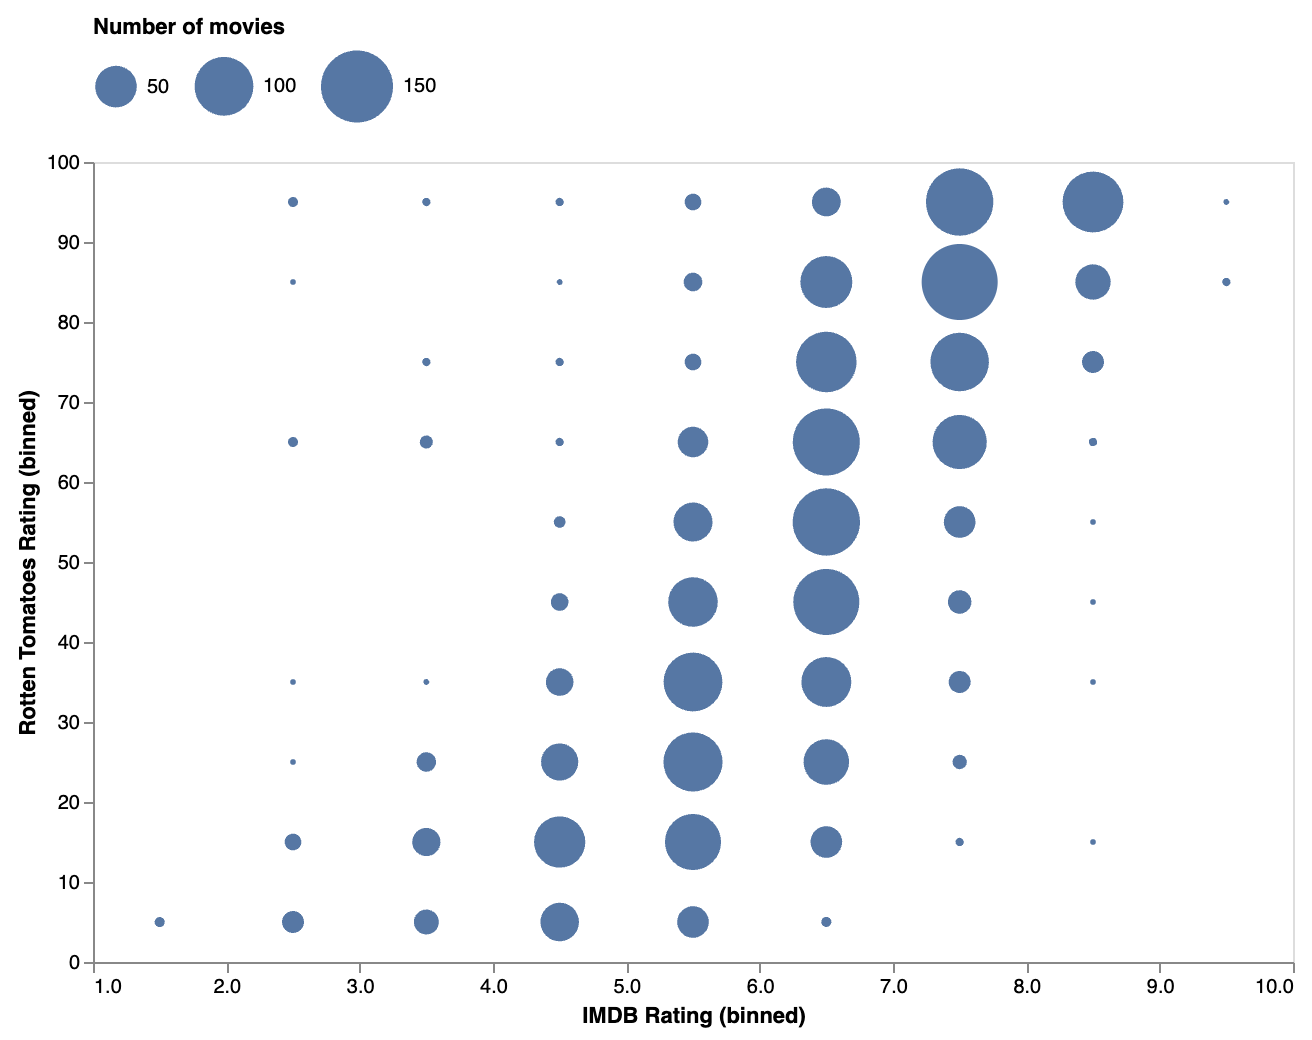
Source: vega.github.io/vega-lite/examples/circle_binned.html
On rare occasions, variables are mapped to the opacity aesthetic. On those occasions, an opacity legend is needed for the reader.
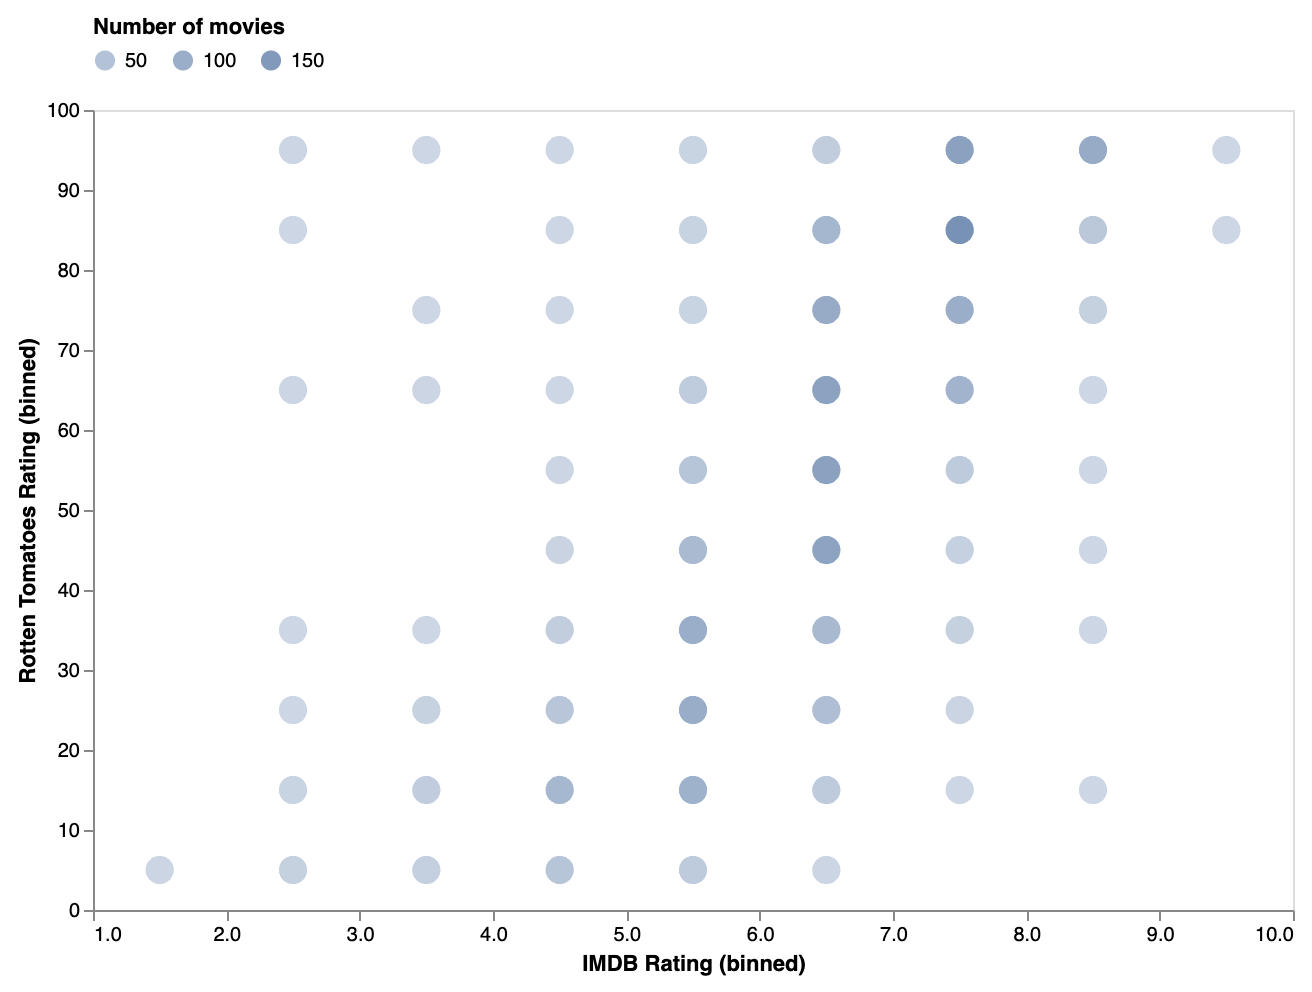
Source: vega.github.io/vega-lite/examples/circle_binned.html
Mapping variables to the opacity aesthetic is rare because opacities are quite hard to decode for viewers. In most cases, mapping to the fill colour aesthetic works better.
Source: vega.github.io/vega-lite/examples/circle_binned.html
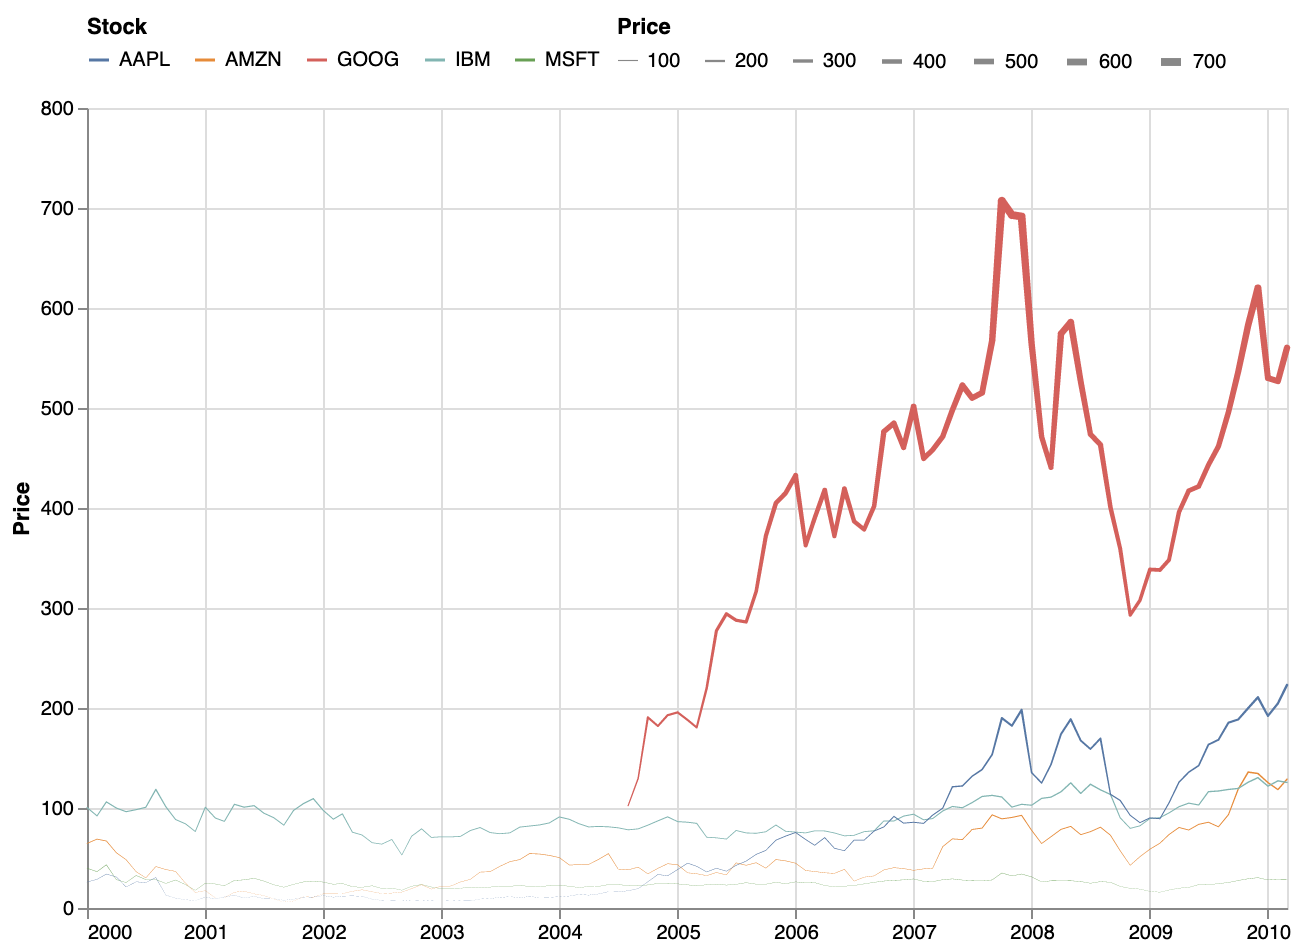
Other aesthetics, like stroke colour and stroke width, also have their own legends.