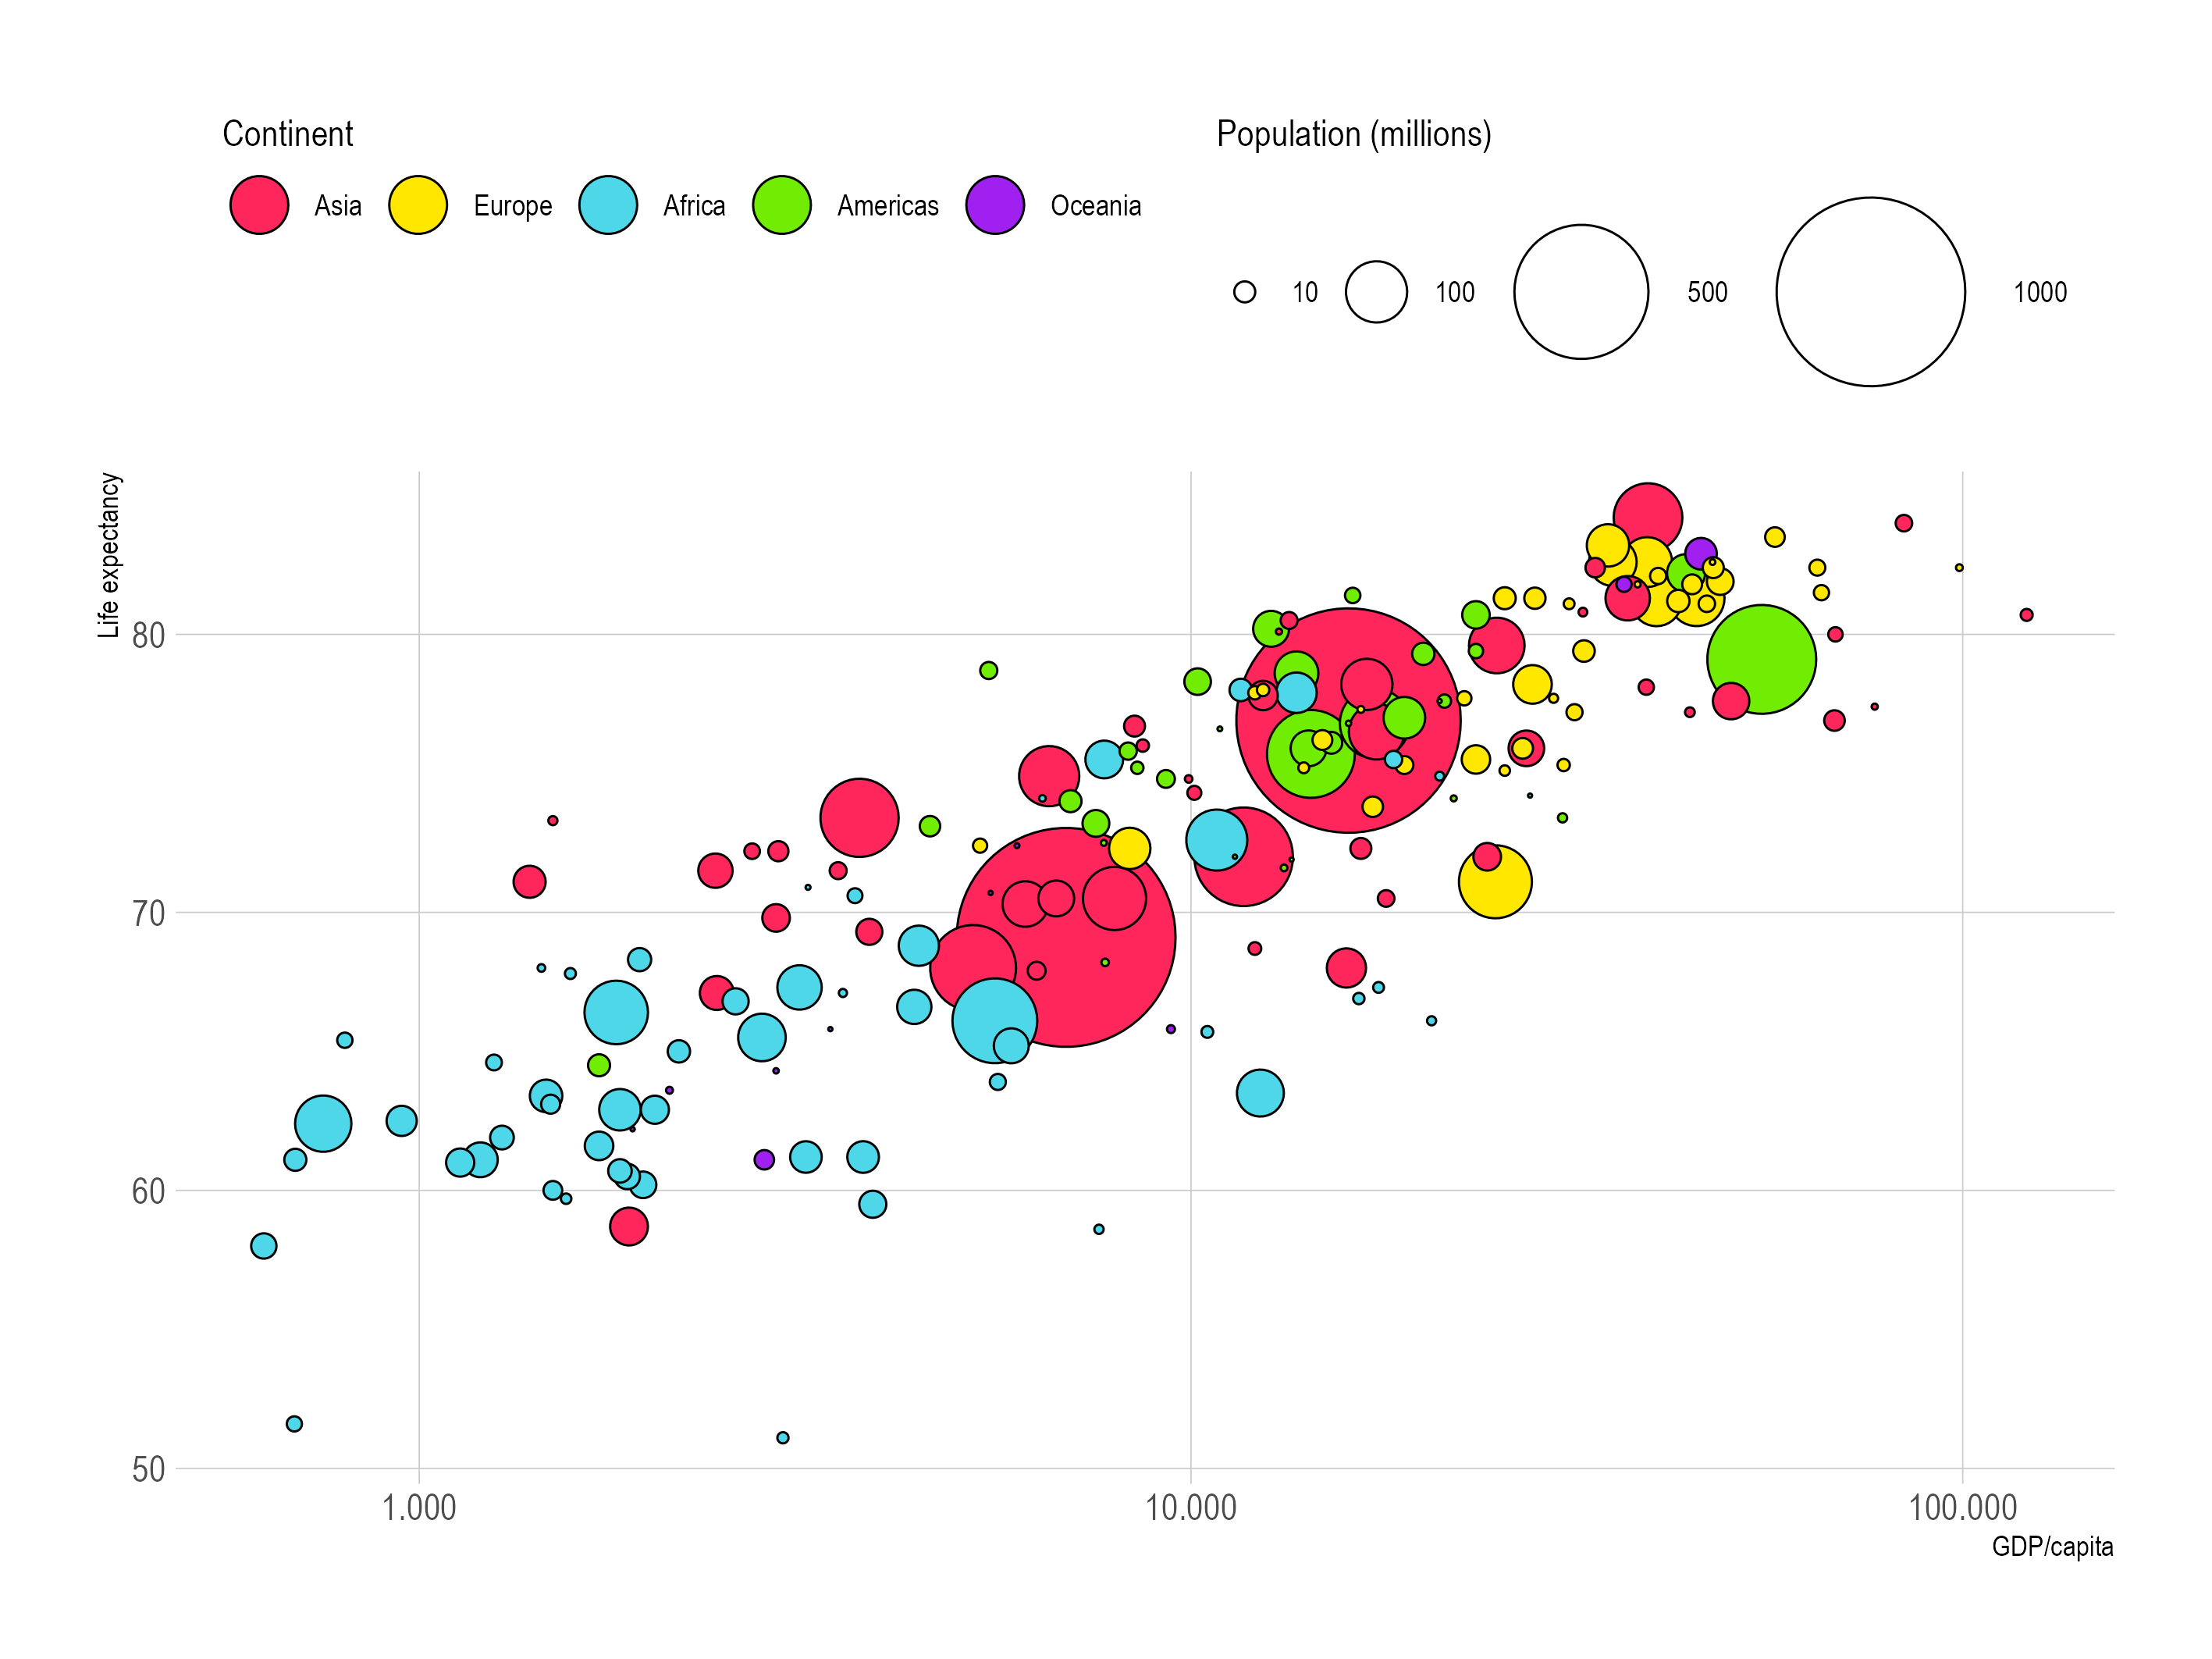
The y scale used in the bubble chart shown below is a linear scale: the positions on the y axis are linearly scaled from values of the life expectancy variable. But if you look closely to the x axis, you can see that x scale is not a linear one.
Source: Maarten Lambrechts, CC BY SA 4.0
The x axis is using a logarithmic scale, which means that numerical values first undergo a logarithmic transformation before they are mapped to the output range (the output range of the x scale is the number of pixels, measured from 0 pixels on the left to the width of the chart measured in pixels on the right).
This means that scales can have transformations built into them. To produce the same plot, you could calculate the logarithm of the values of the income variable and then use a linear scale. But for convenience all the implementations of the Grammar of Graphics offer scales with a logarithmic transformation built into them.
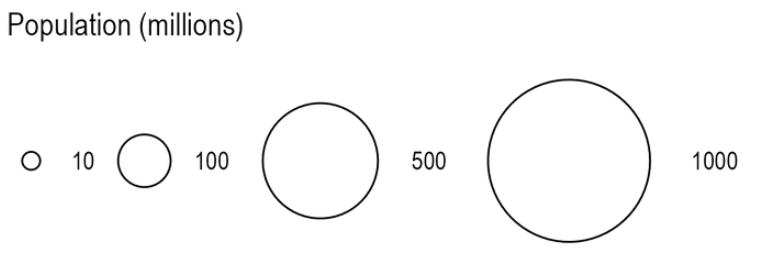
The size scale is using another transformation. In order to assure that the surface area of the circles is proportional to the values of the population variable, the scale takes the square root of the population values before mapping them to the radius of the circles.
Because the surface area of a circle is calculated as
mapping the population numbers directly to the radius of the circles would make the surface areas of the countries with high population numbers disproportionally bigger compared the circles representing countries with smaller populations. Taking the square root of the population values ensures that the surface areas of the circles is proportional to the values.
Source: Maarten Lambrechts, CC BY SA 4.0
Time scales are a special kind of linear scales that convert temporal variables (dates and times) to x (or sometimes y) positions. Time scales usually have some options to change the formatting of the tick labels.

An example of time axis, which is the visual representation of a time scale. Source: observablehq.com/@observablehq/plot-scales
When categorical variables are mapped to the x or y aesthetic, the output range (the height or width of the plot) is divided into regular intervals. The number of is calculated from the number of unique values of the categorical variable.
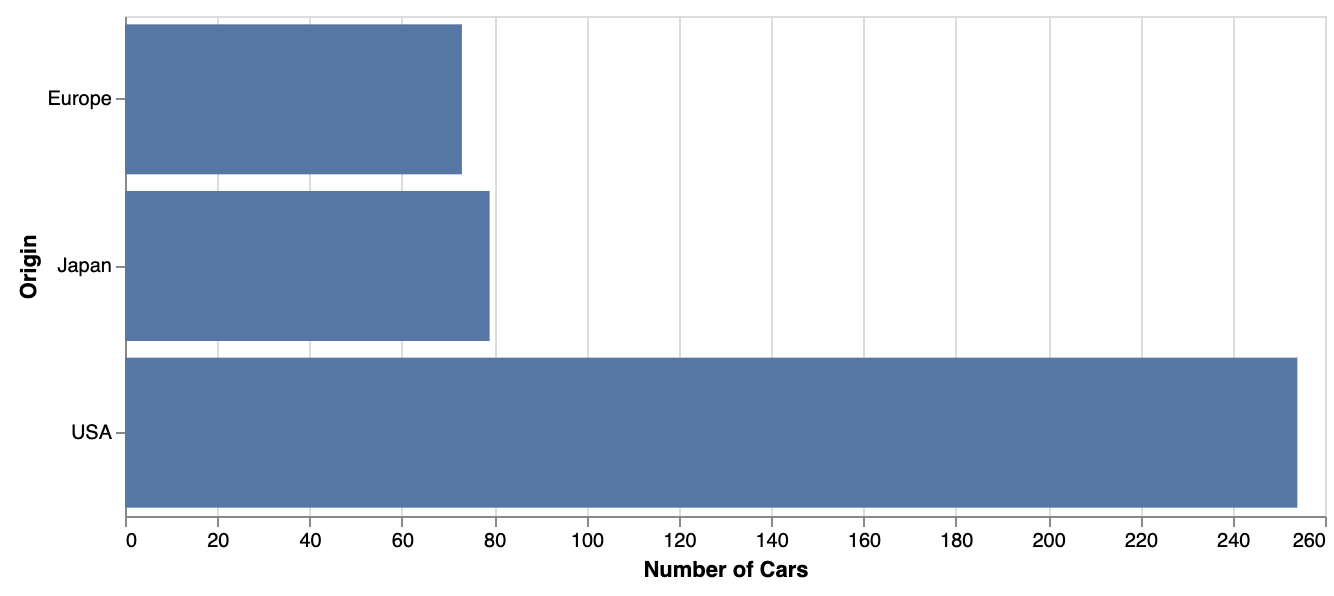
The range of the y scale of this bar chart is distributed among the 3 unique values (Europe, Japan and USA) of the categorical Origin variable in this bar chart. Source: vega.github.io/vega-lite/examples/bar_size_responsive.html
Categorical variables can be mapped to colour using discrete colour scales. In the bubble chart above, the Continent variable is mapped to colour, so that all continents get their own colour in the plot. In the case of discrete colour scales, the domain of the scale is the list of unique values (in this case the continent names) and the range is the list of colour values.
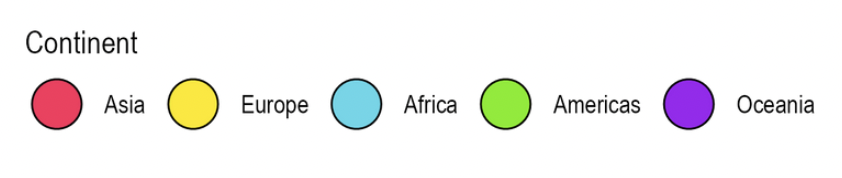
Source: Maarten Lambrechts, CC BY SA 4.0
A shape scale is similar to a discrete colour scale, but returns shapes instead of colour values.
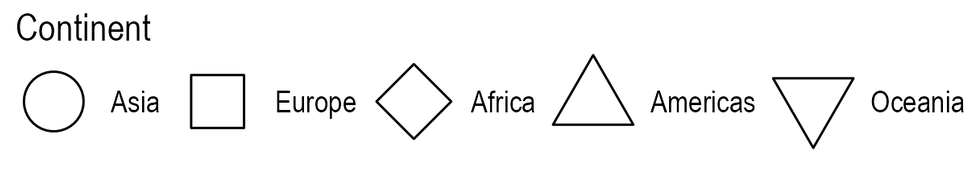
Source: Maarten Lambrechts, CC BY SA 4.0
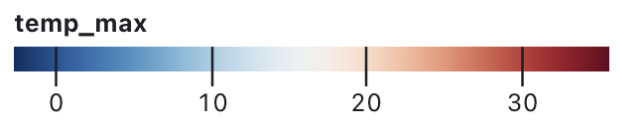
For ordinal variables (in which the values have a natural order) and for binned variables (in which numerical values are binned together) mapped to colour, ordinal colour scales can be used.
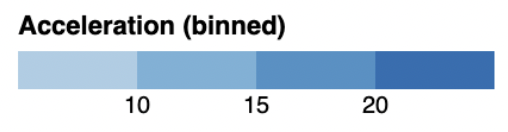
Source: vega.github.io/vega-lite/docs/bin.html
Finally, continuous colour scales are used to map continuous numerical data to a continuous colour range.