Semantic interactive HTML elements are handled quite well by browsers on mobile phones. If you do provide other interactive elements, make sure they are big enough to be properly “touchable”. This avoids the “fat finger problem” where users on smaller touch enabled screens have difficulties interacting with elements because they are too small, or too close together to be interacted with easily.
On top of the fat finger problem, users occlude the visualisation they are interacting with when touching it. An external user input, like a slider or a date picker, can help mobile users to consult the exact data points in a data visualisation.
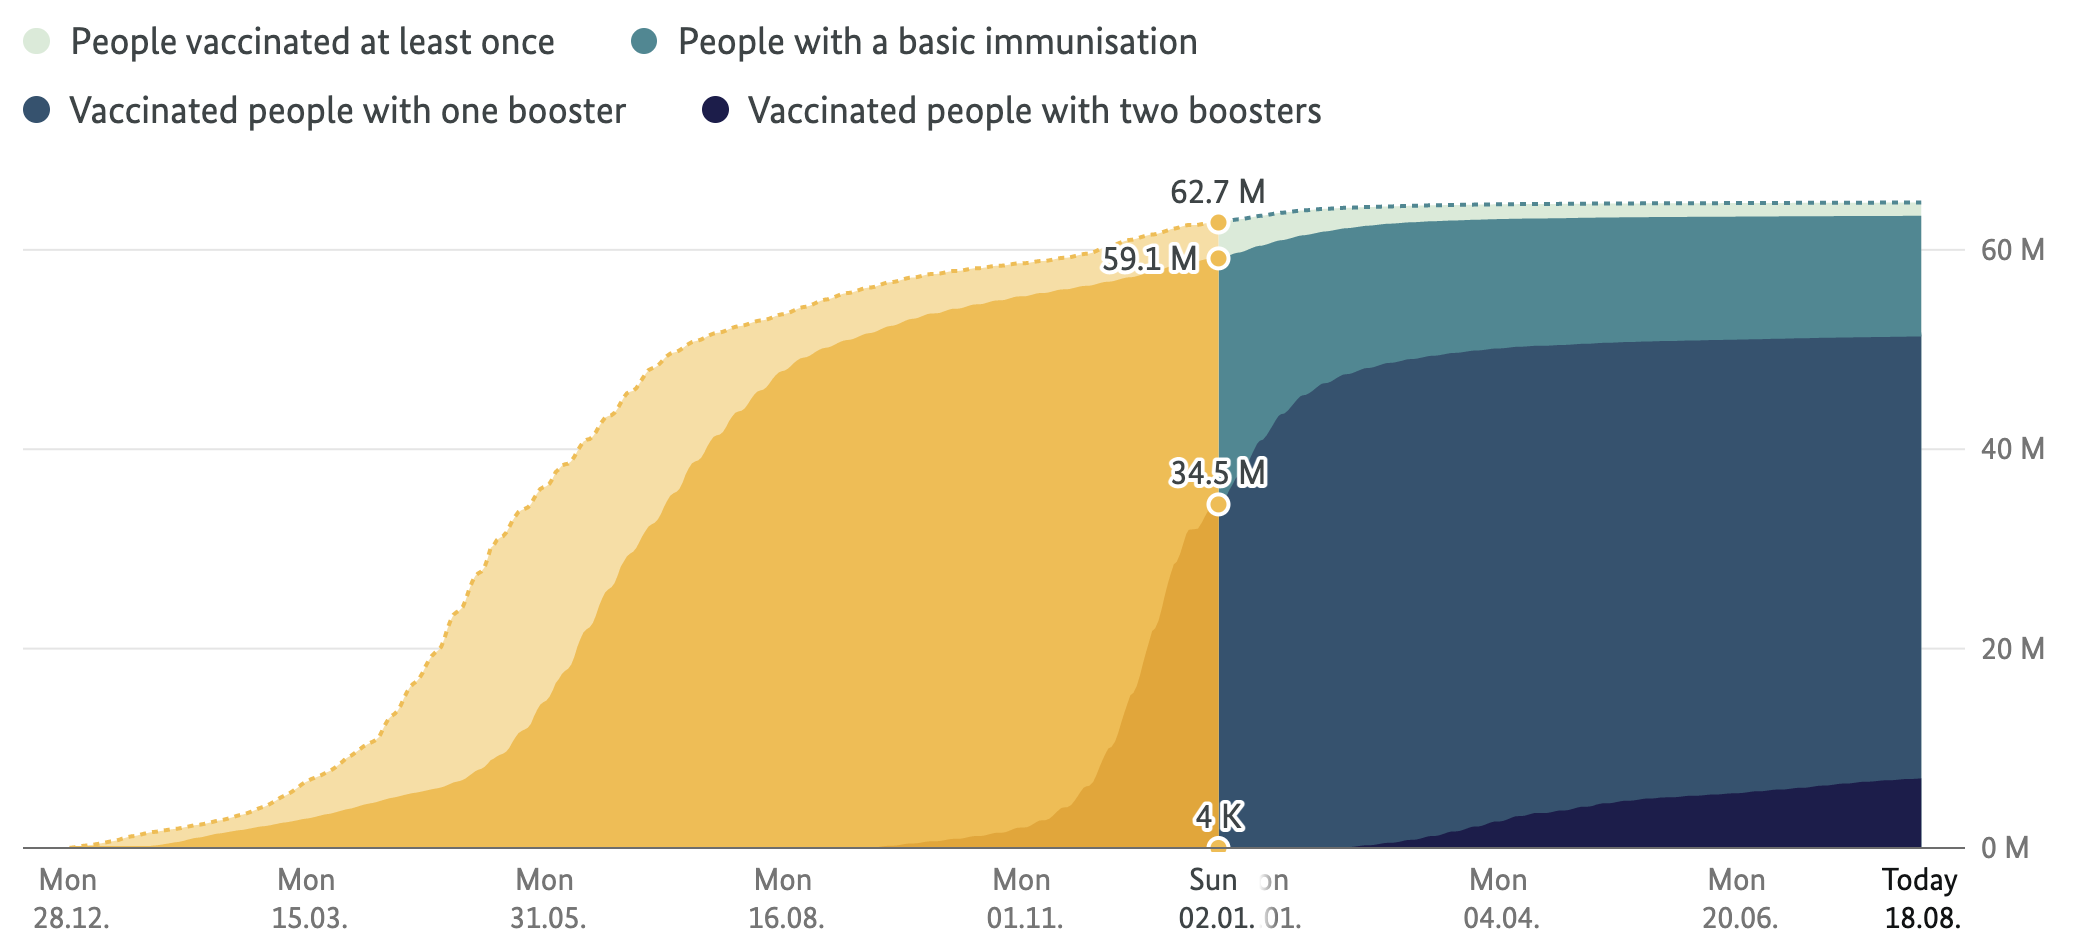
On screens without touch, this chart from the German Covid-19 vaccination dashboard reveals details when hovered over with a mouse. Source: impfdashboard.de
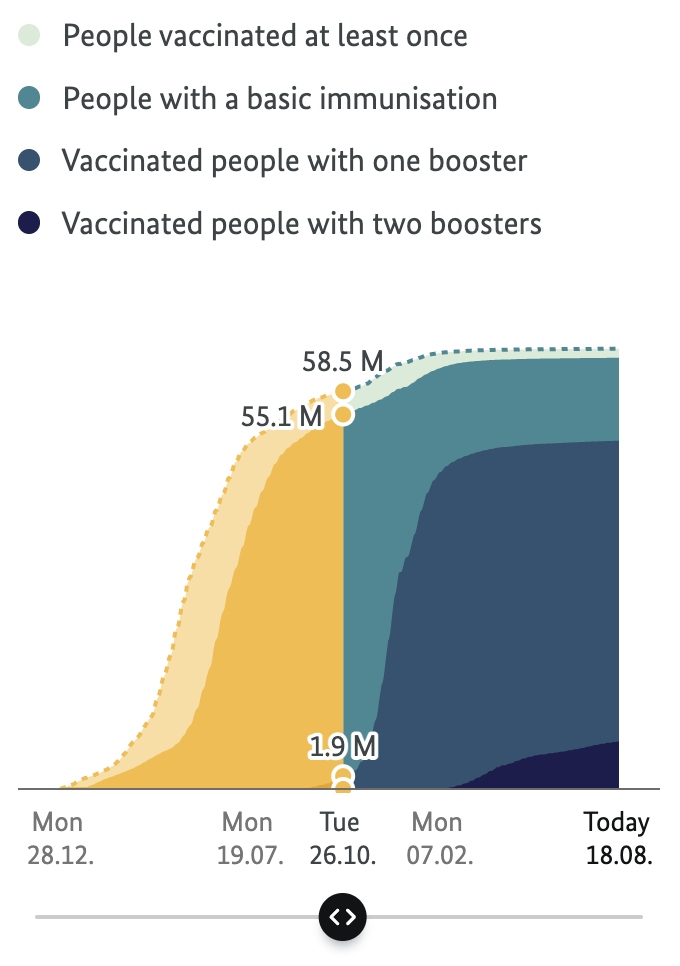
On touch enabled devices, the interaction is through a slider. Source: impfdashboard.de
To test how the interactivity behaves on mobile phones and other touch enabled devices, you can use the device simulator that is built into the Chrome browser. To do so, open the Chrome developer tools (by clicking right on a web page, and selecting “Inspect element” for example) and then click the little tablet/mobile phone icon in the top left of the developer tools.
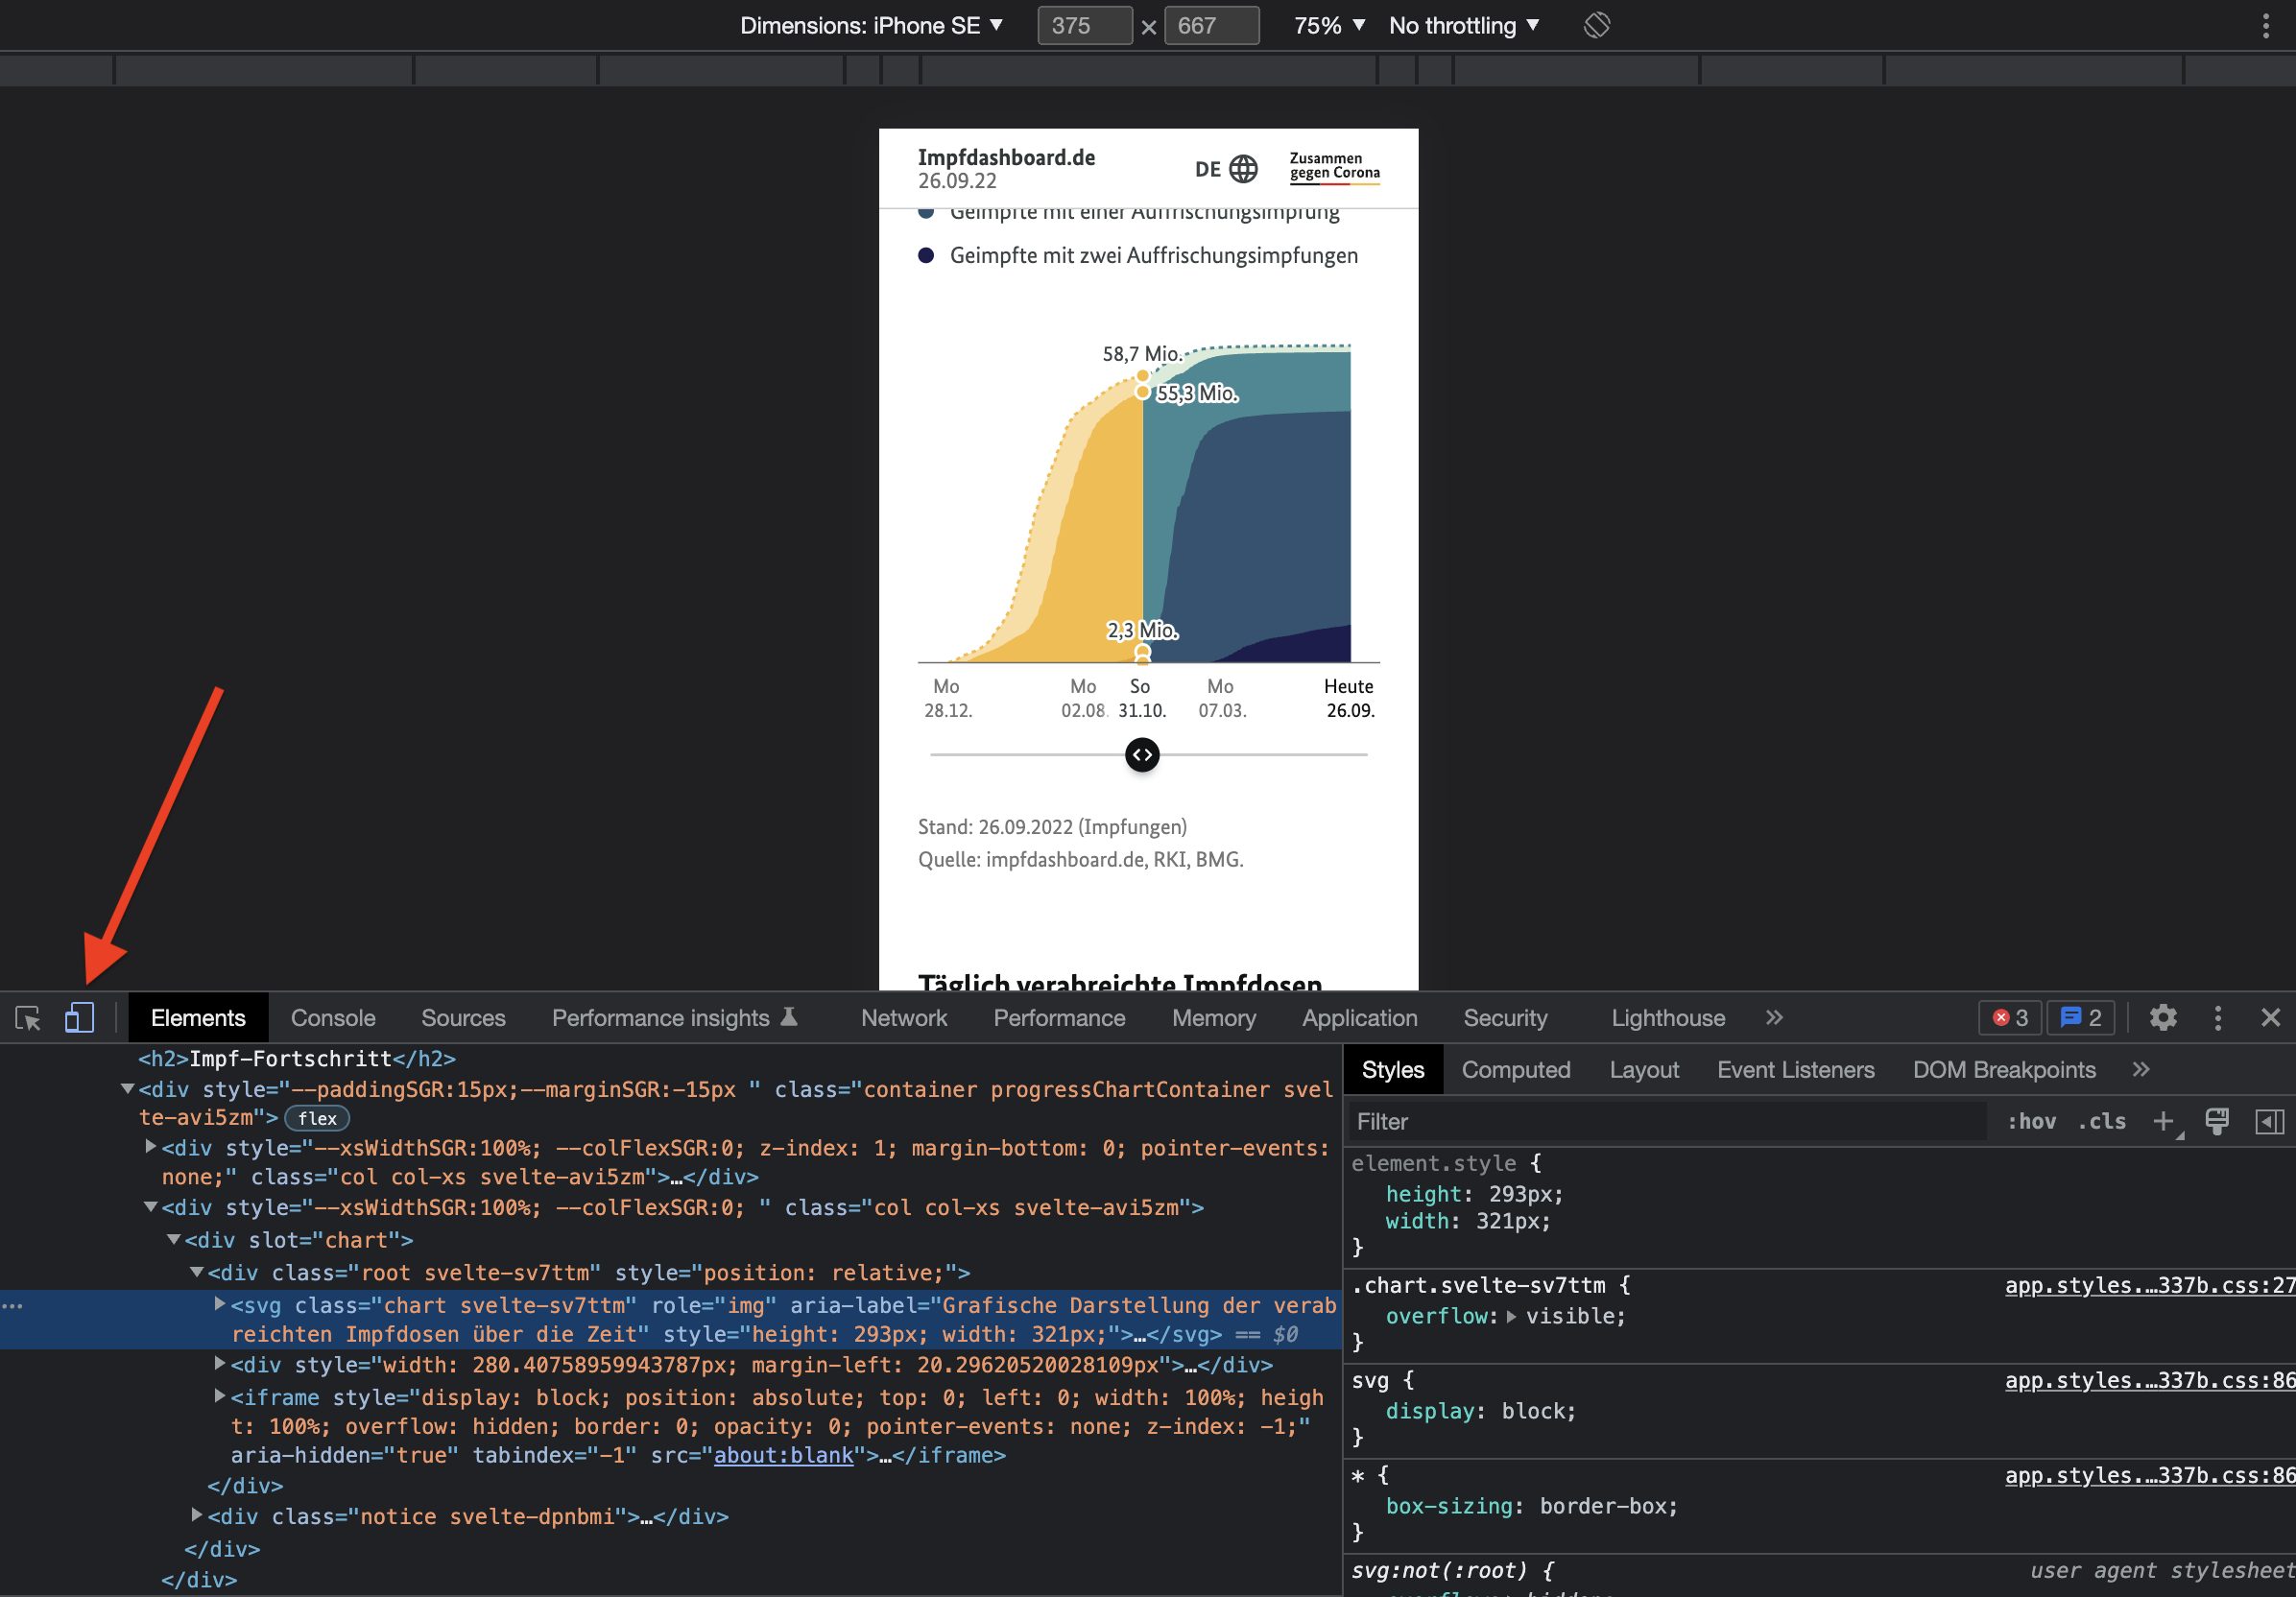
Click the mobile phone/tablet icon to simulate a web page’s behaviour on different devices. Source: Maarten Lambrechts, CC BY SA 4.0
This will display the device toolbar at the top of the browser window, form which you can select different devices. The cursor will show as a semi transparent circle, and clicks will simulate a touch.