Cartograms are maps in which the geography is altered to let the surface area of geographic entities be proportional to a numerical value. Below is an example of a cartogram showing the total population of African countries. The dark red country on this map, Nigeria, is blown up because it has a big population, while other countries have shrunken because of their low populations.
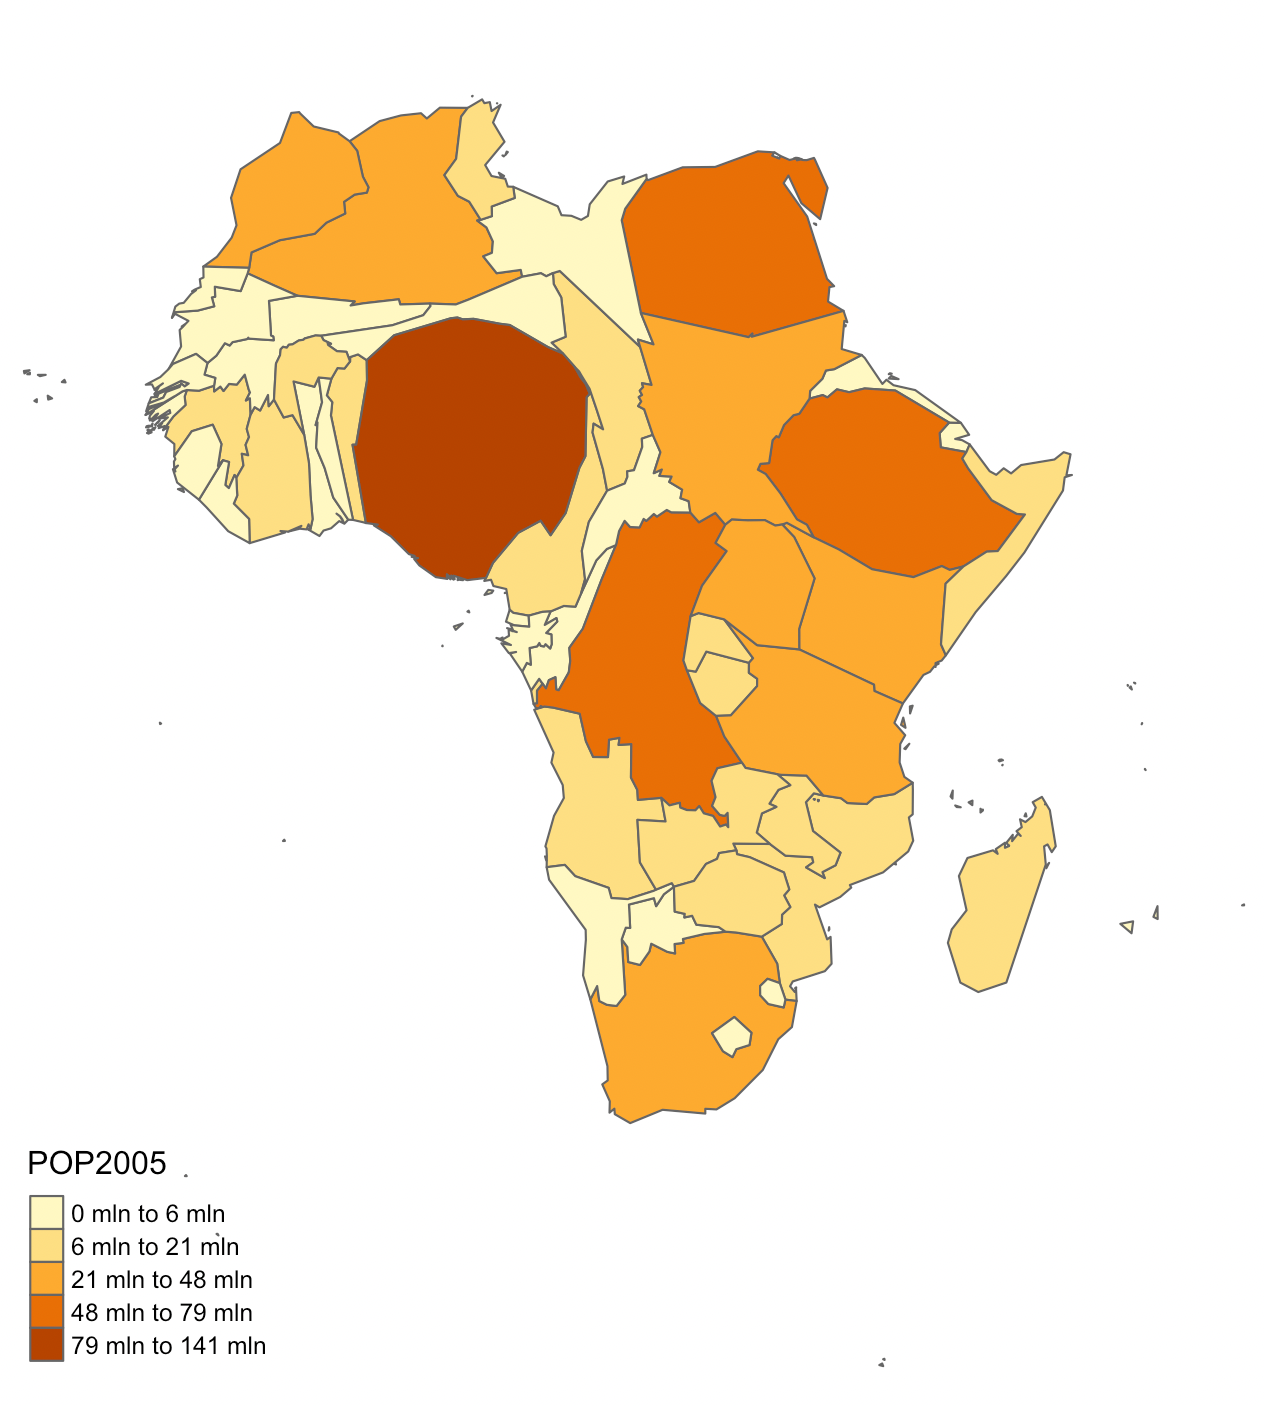
Source: Maarten Lambrechts, CC BY SA 4.0
The cartogram above is called a contiguous cartogram. In a contiguous cartogram, neighbouring entities keep their shared boundaries.
The cartogram below is a non-contiguous cartogram: the countries are scaled to represent their populations, and as a result, neighbouring countries no longer touch each other.
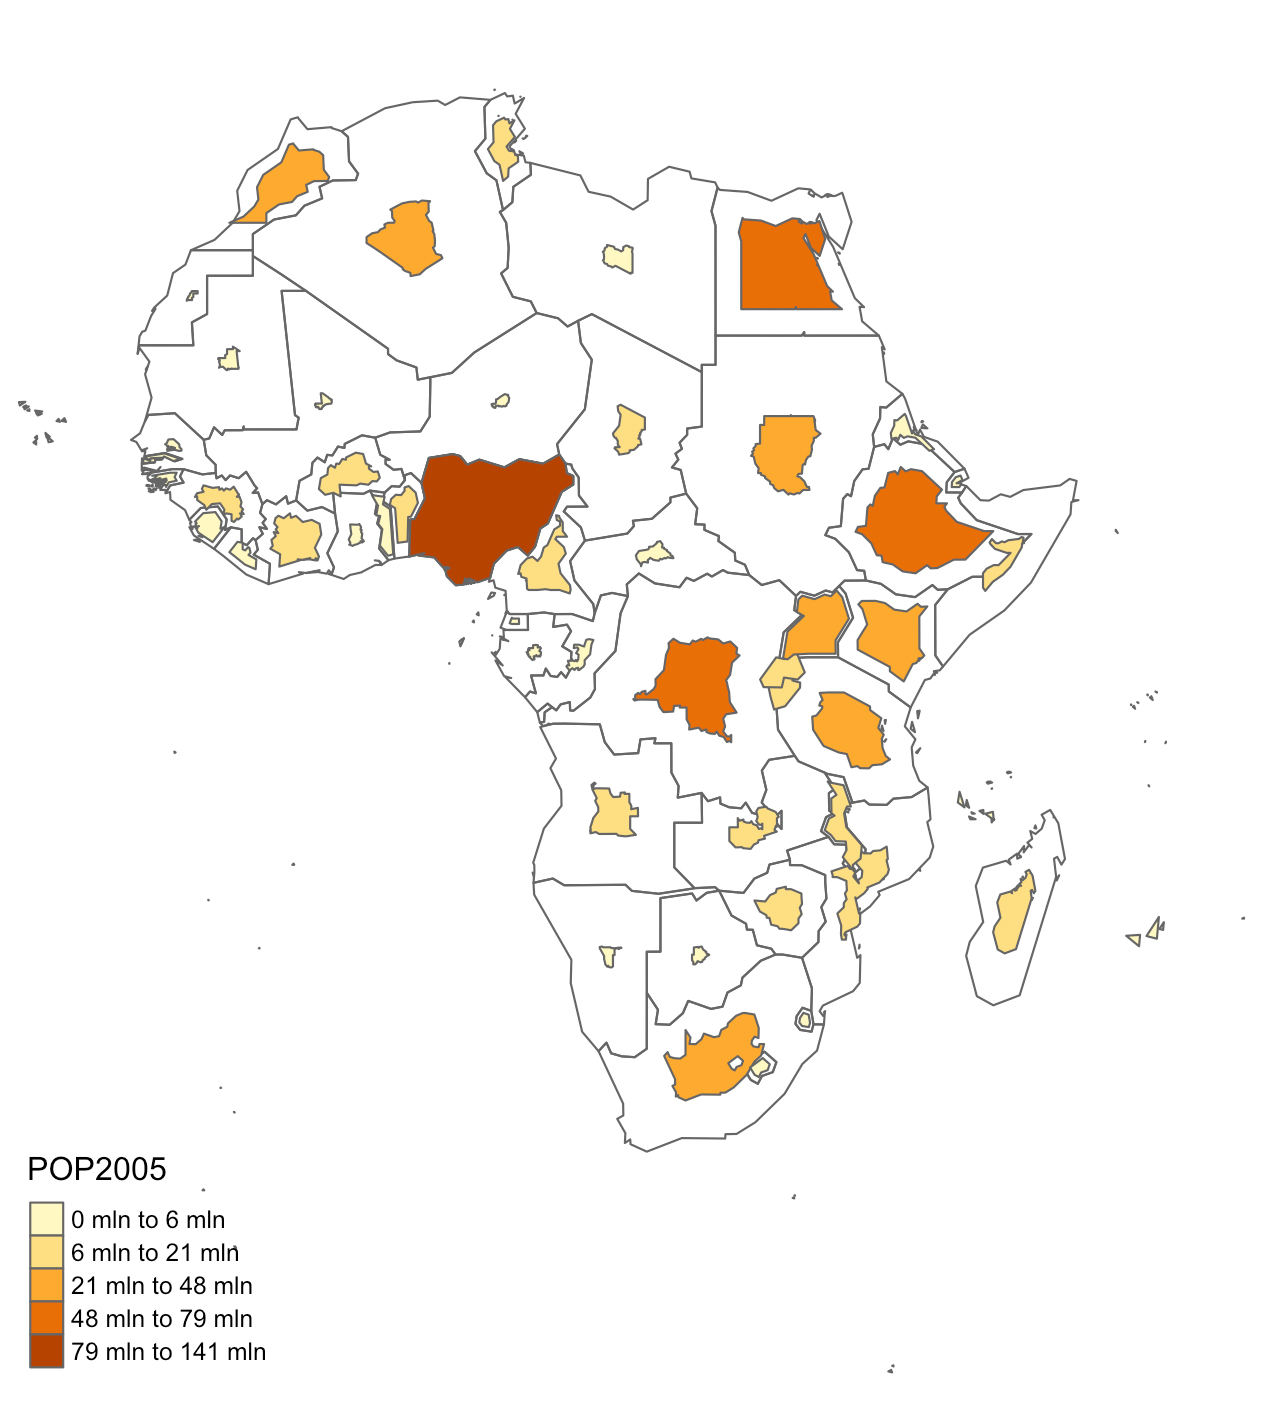
Source: Maarten Lambrechts, CC BY SA 4.0
In a Dorling cartogram, the shapes of the geographical entities are completely abstracted into circles which are scaled to represent the values of a numerical variable.
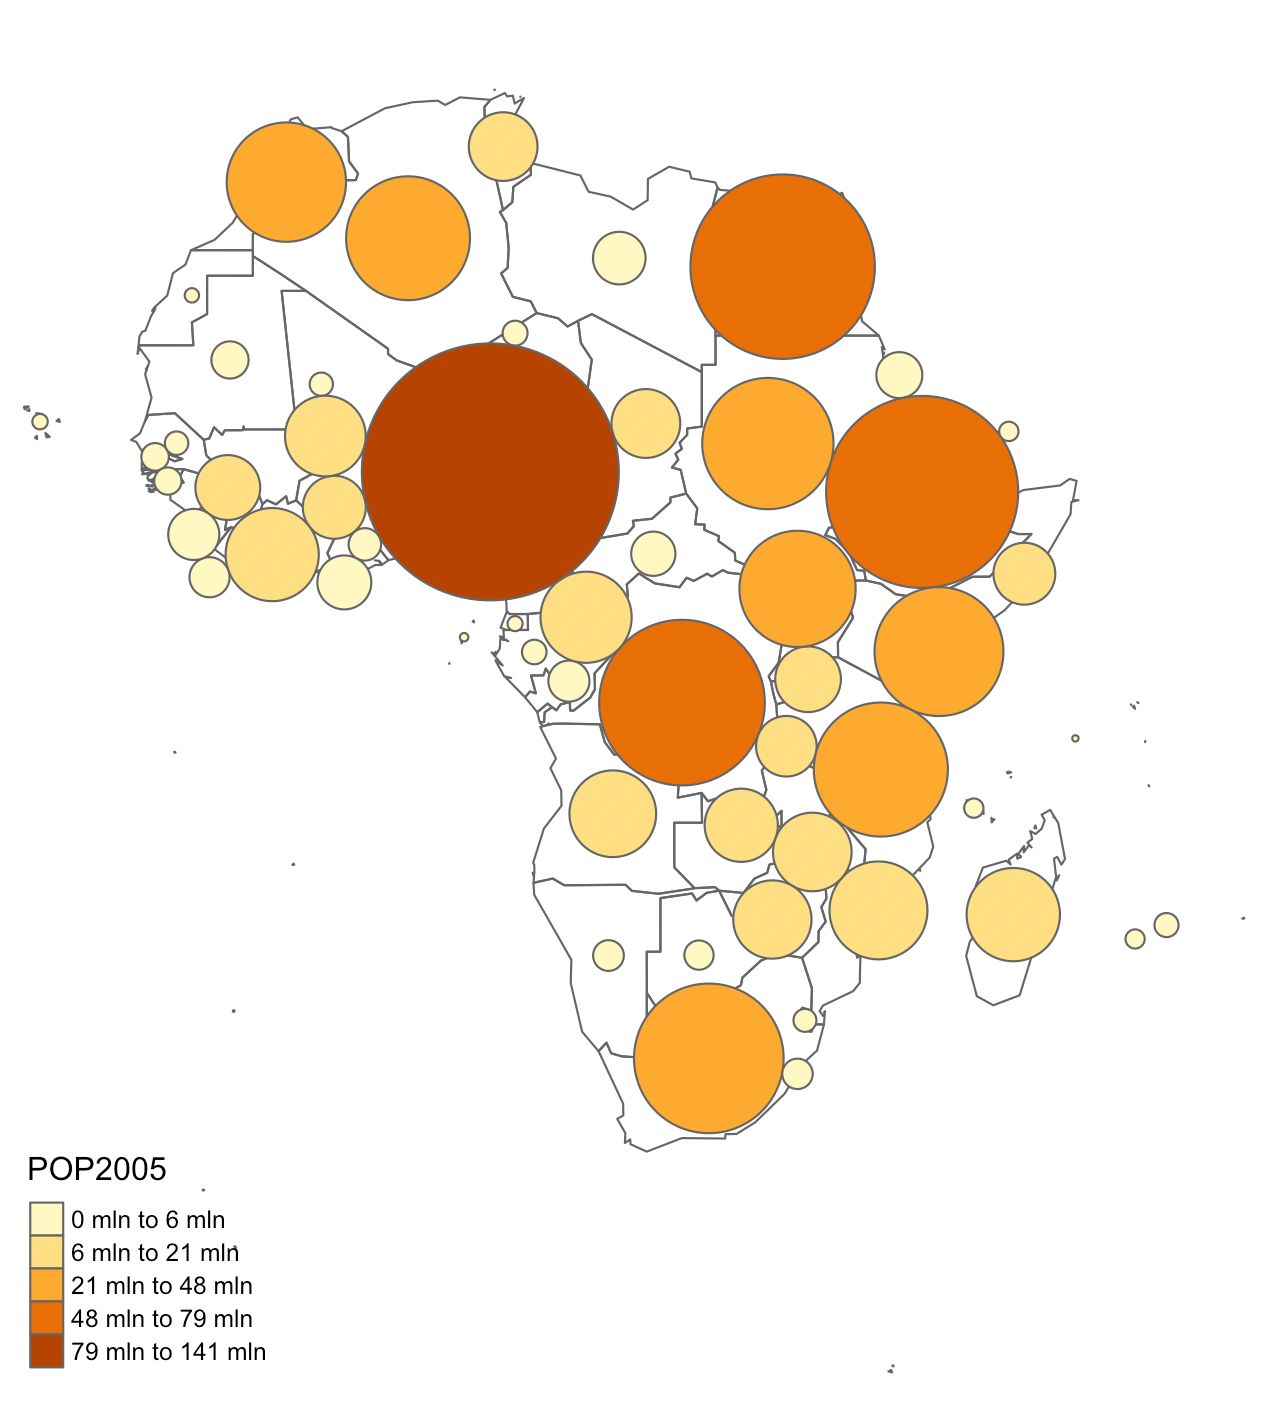
Source: Maarten Lambrechts, CC BY SA 4.0
A Dorling cartogram is very similar to a proportional symbol map, but in a Dorling cartogram the circles are usually scaled and positioned so that the circles touch each other. In a proportional symbol map, circles are more tied to a geographical position and may overlap to some extent. In Dorling cartograms, the circles may shift away from the true location of the entities they represent.
A Demers cartogram is similar to a Dorling cartogram, but uses squares instead of circles.
When squares used to represent countries or other geographical entities, and the squares are arranged on a regular grid, the map is called a tile grid map.
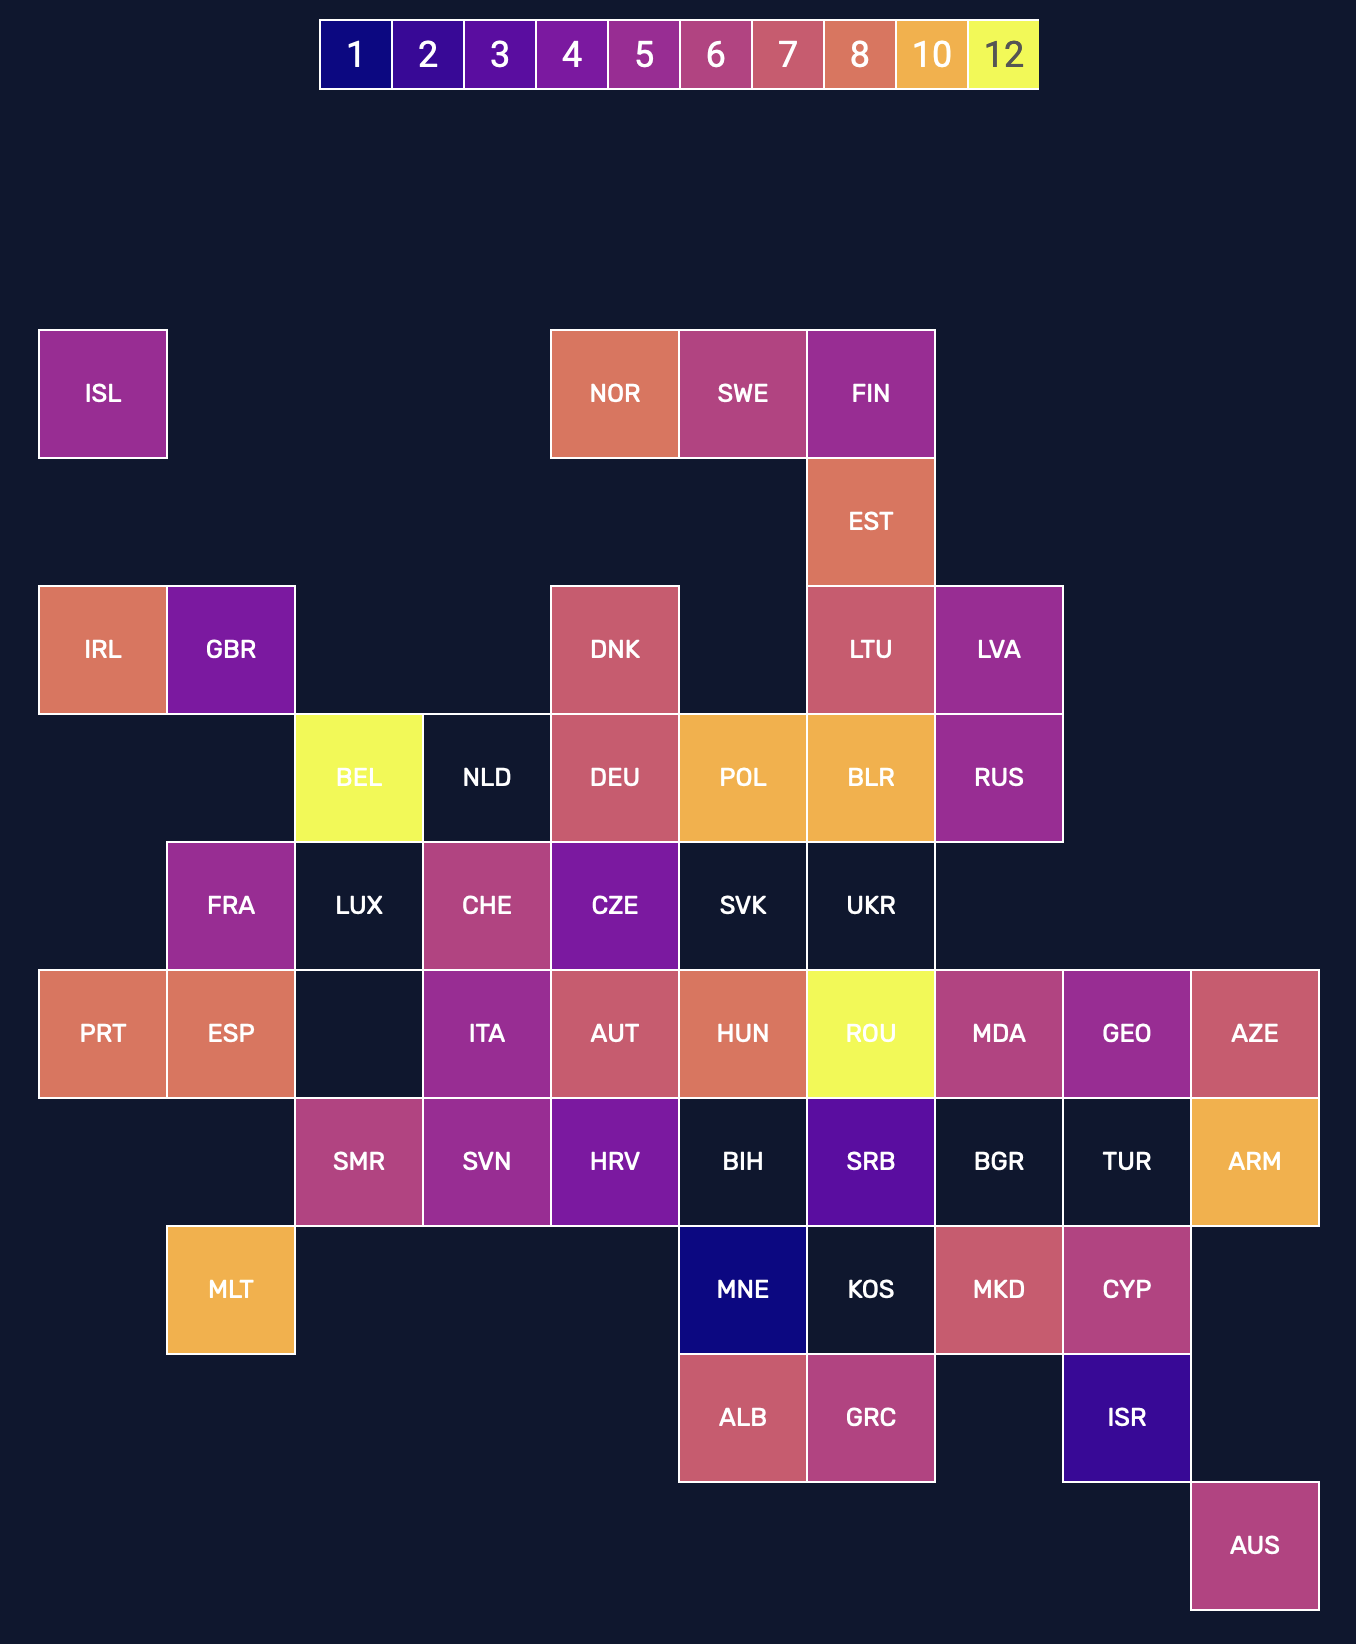
A tile grid map of Europe (plus Australia) showing Eurovision Song Contest voting patterns (televoting points awarded to the Netherlands). Equally sized tiles were used because the votes from each country have equal weights. Source: The Eurosearch Song Contest 2019, googletrends.github.io
Tile grid maps distort the geography even more than Dorling and Demers cartograms do: neighbouring countries may be separated and countries close together can end up far away from each other. So when it is important to show geographical patterns, tile grid maps are not a good option.
However, tile grid maps can be used to show mini charts for each entity in the grid. The tile grid map below shows the share of the population using the internet in African countries, for example.
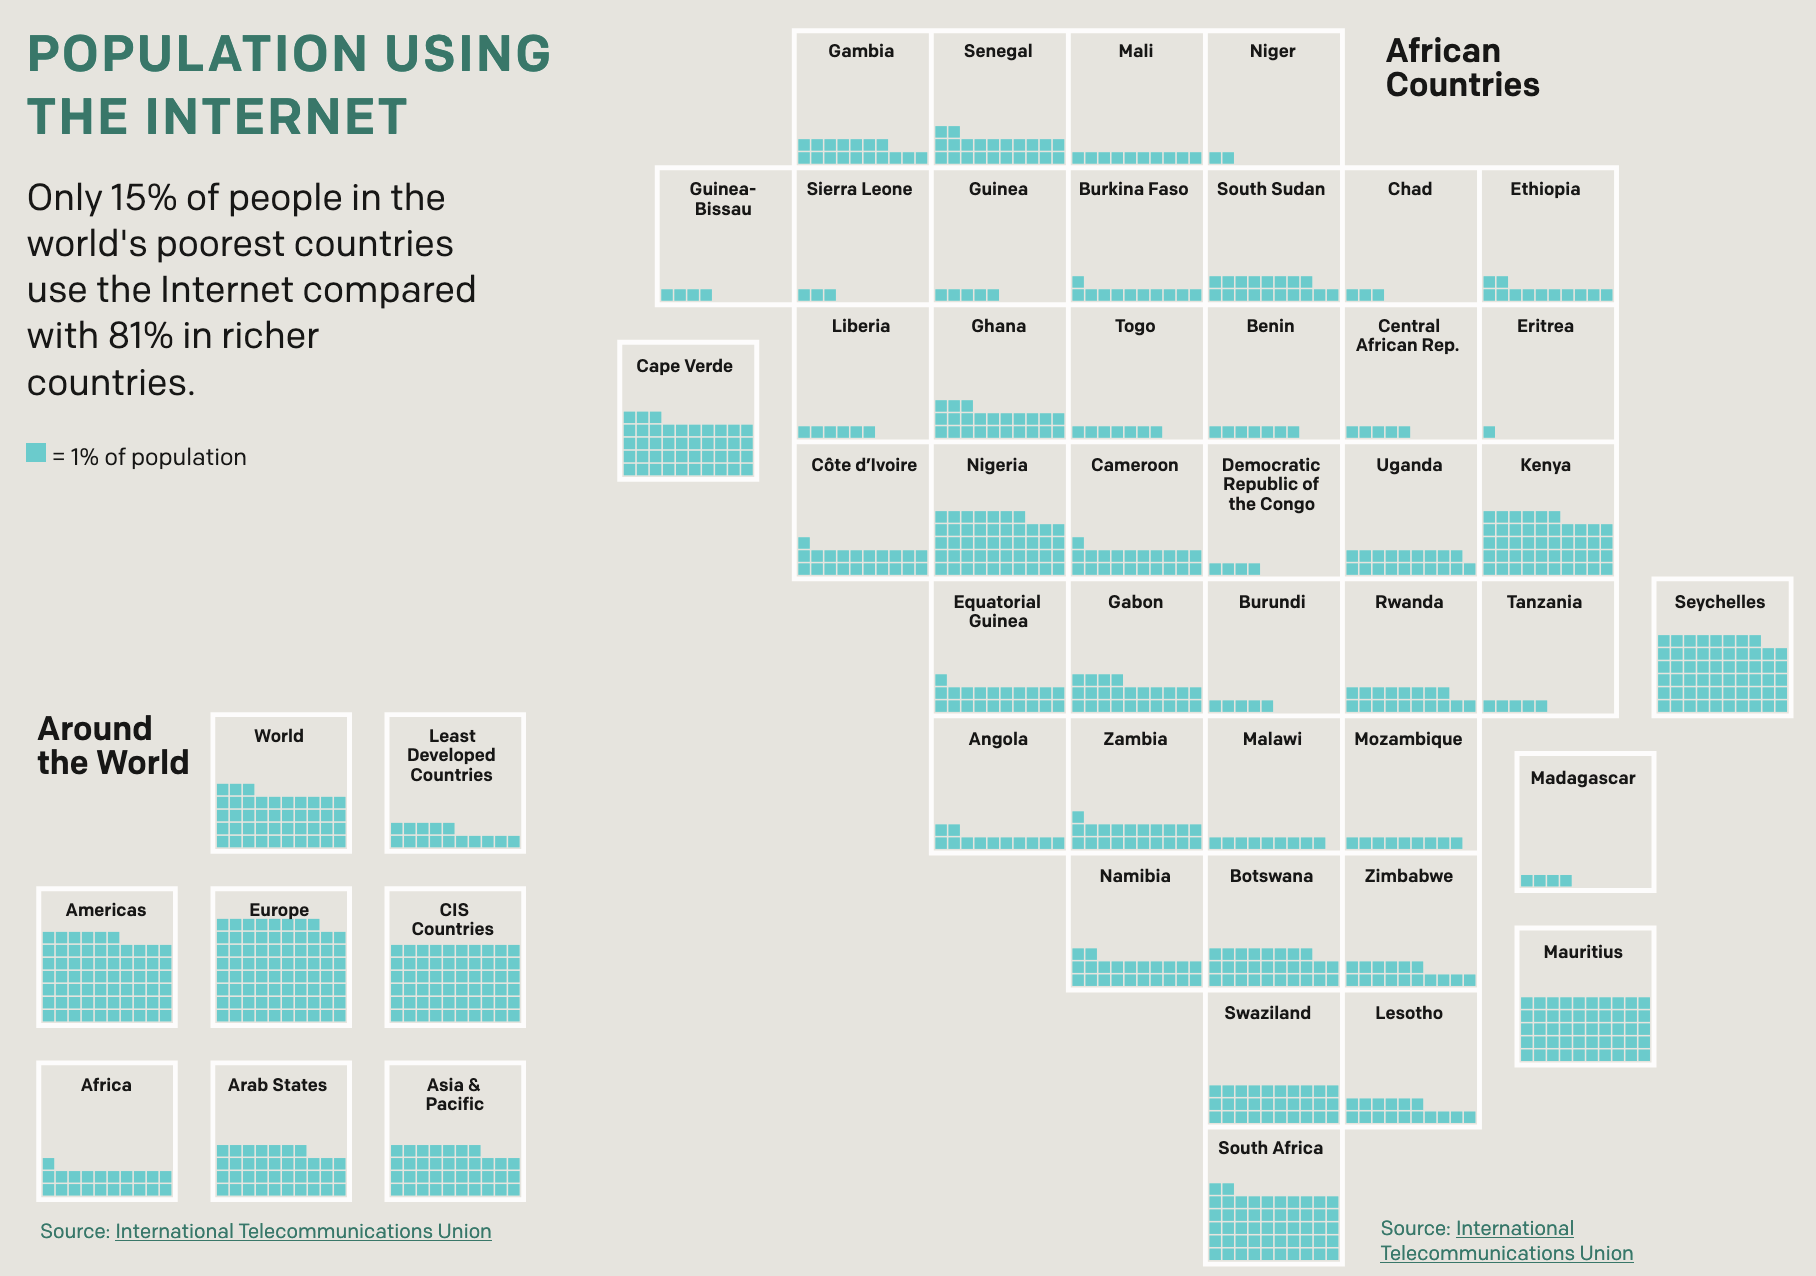
Source: Making the connection: how the internet can help end extreme poverty, one.org