Flow maps, also known as origin-destination maps, are maps that show the direction and magnitude of flows between geographical areas or points. Many techniques exist to depict flows on a map.
French engineer Charles Joseph Minard was a pioneer in making flow maps in the nineteenth century. His map of Napoleon’s Russian campaign became an icon of the data visualisation world, but he made many other flow maps. The map below shows the kind and quantity of livestock that were transported to Paris from the surrounding regions in 1862. The width of each segment of the flows is proportional to the quantities.
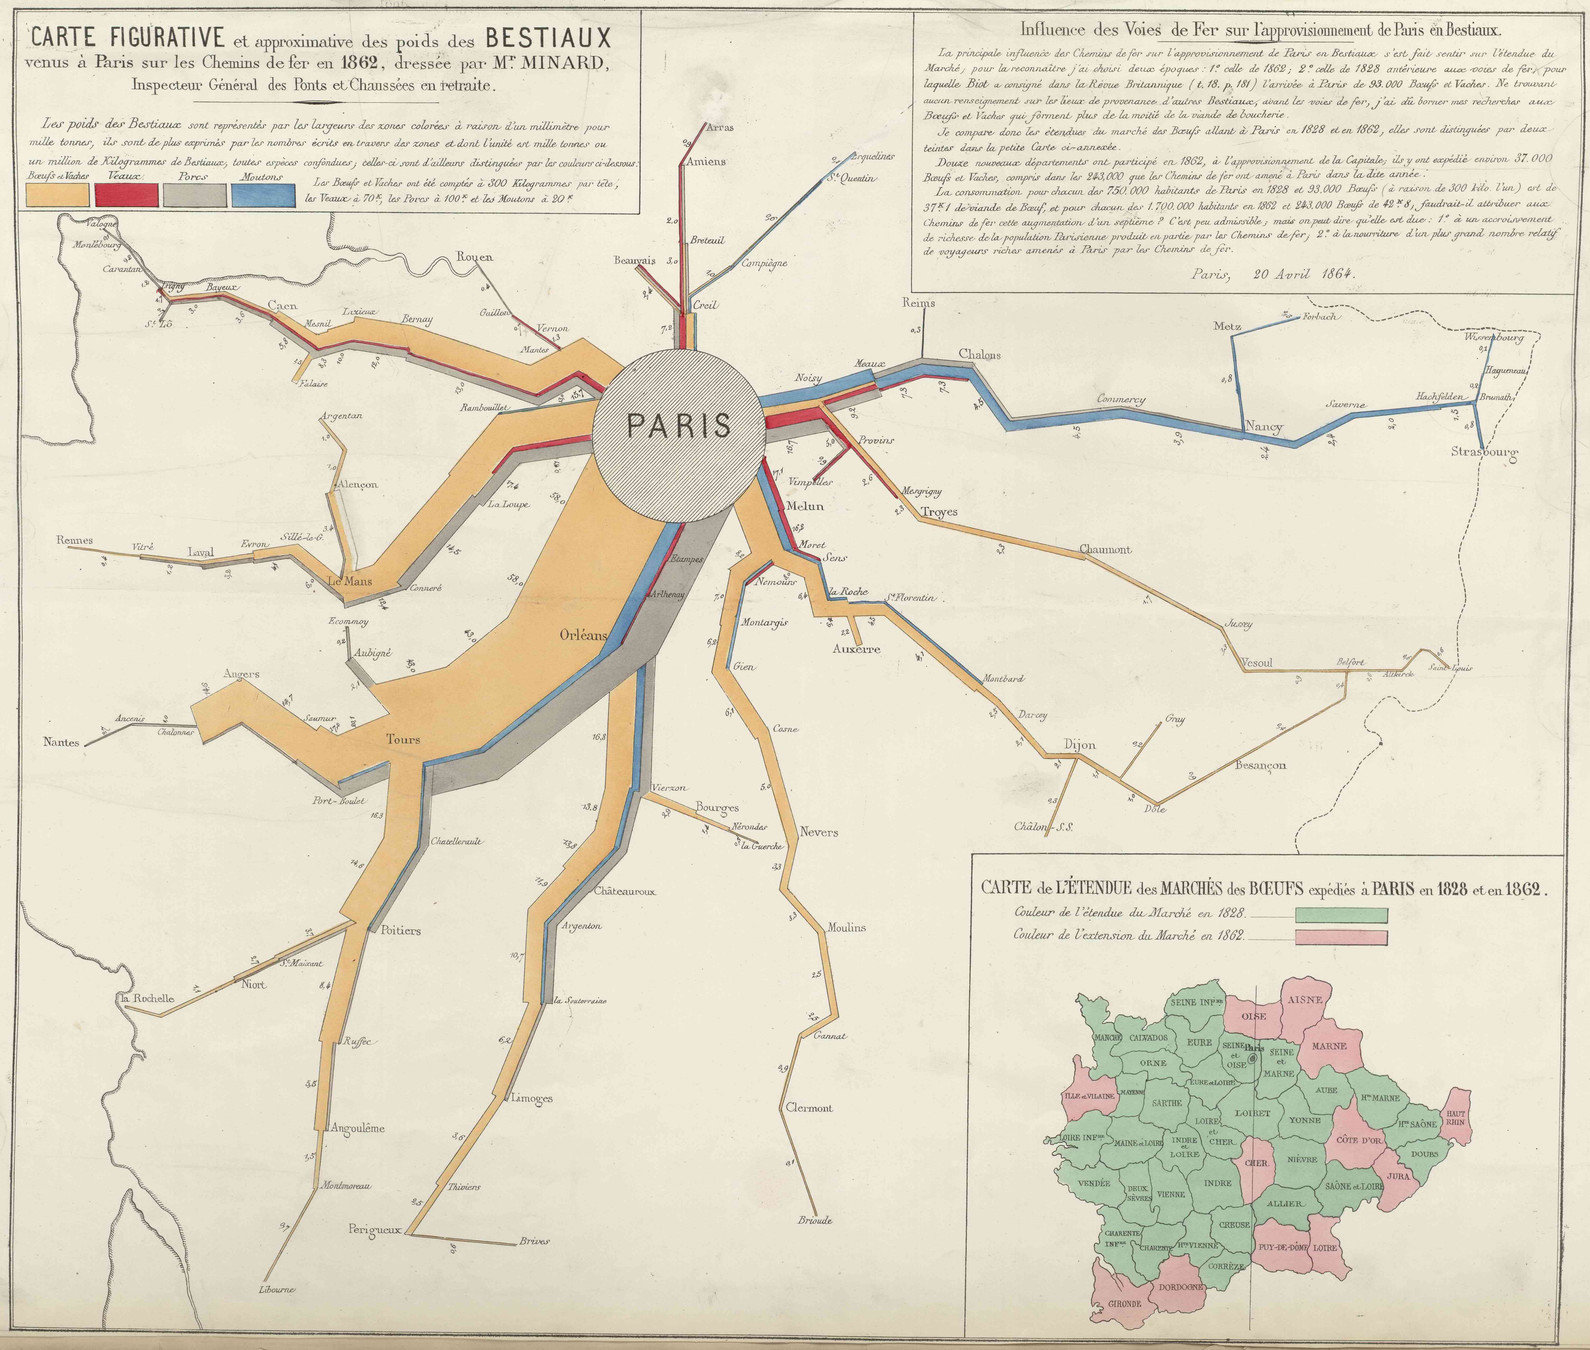
Source: École nationale des ponts et chaussées
The map below uses a technique akin to a Sankey diagram: it groups the lines originating from the sources together, and splits it over the destination countries moving to the right of the map.
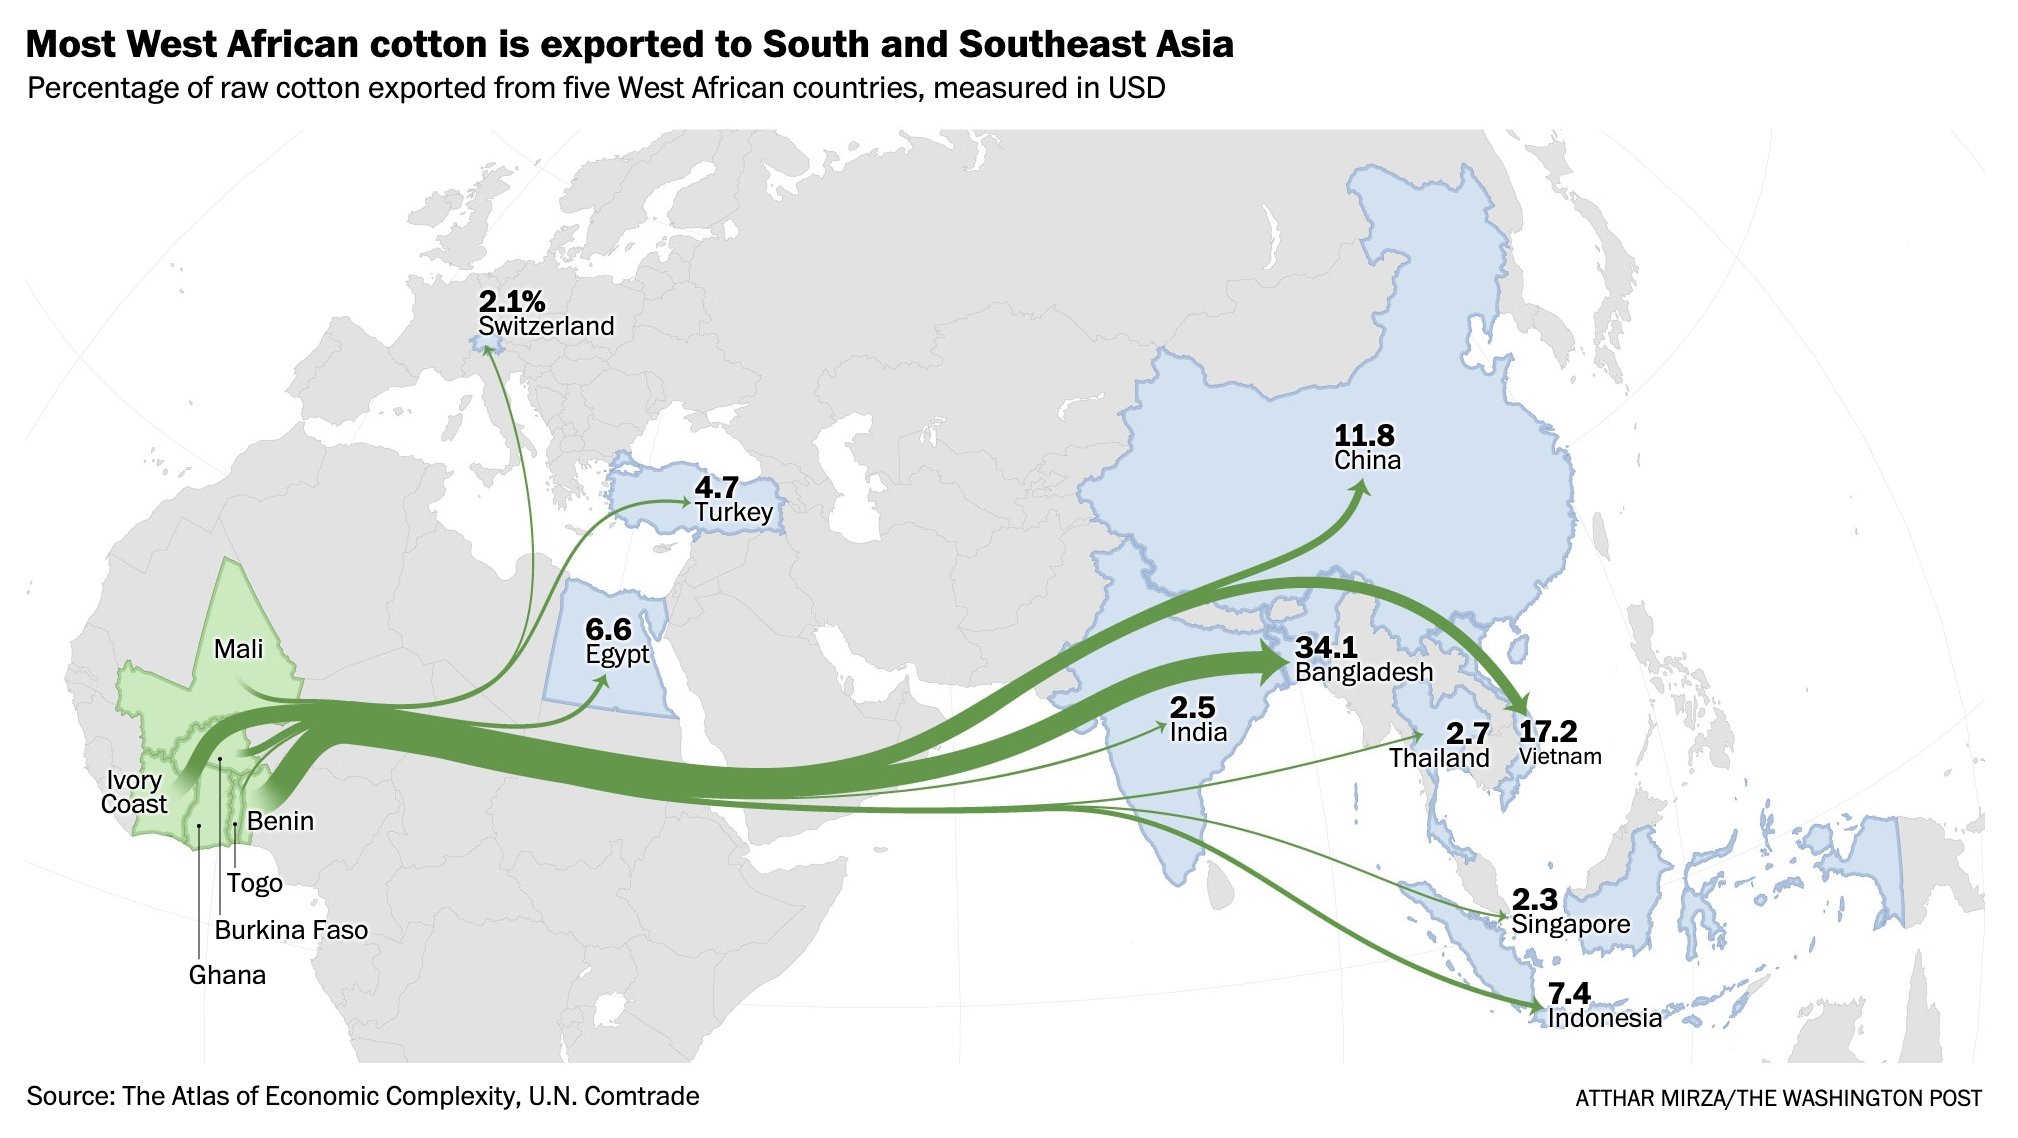
Source: @atthar_mizra
The flow map belows shows global migration patterns between countries and uses a technique called edge bundling to group connections between countries and continents together to decrease the clutter that complex networks can suffer from.
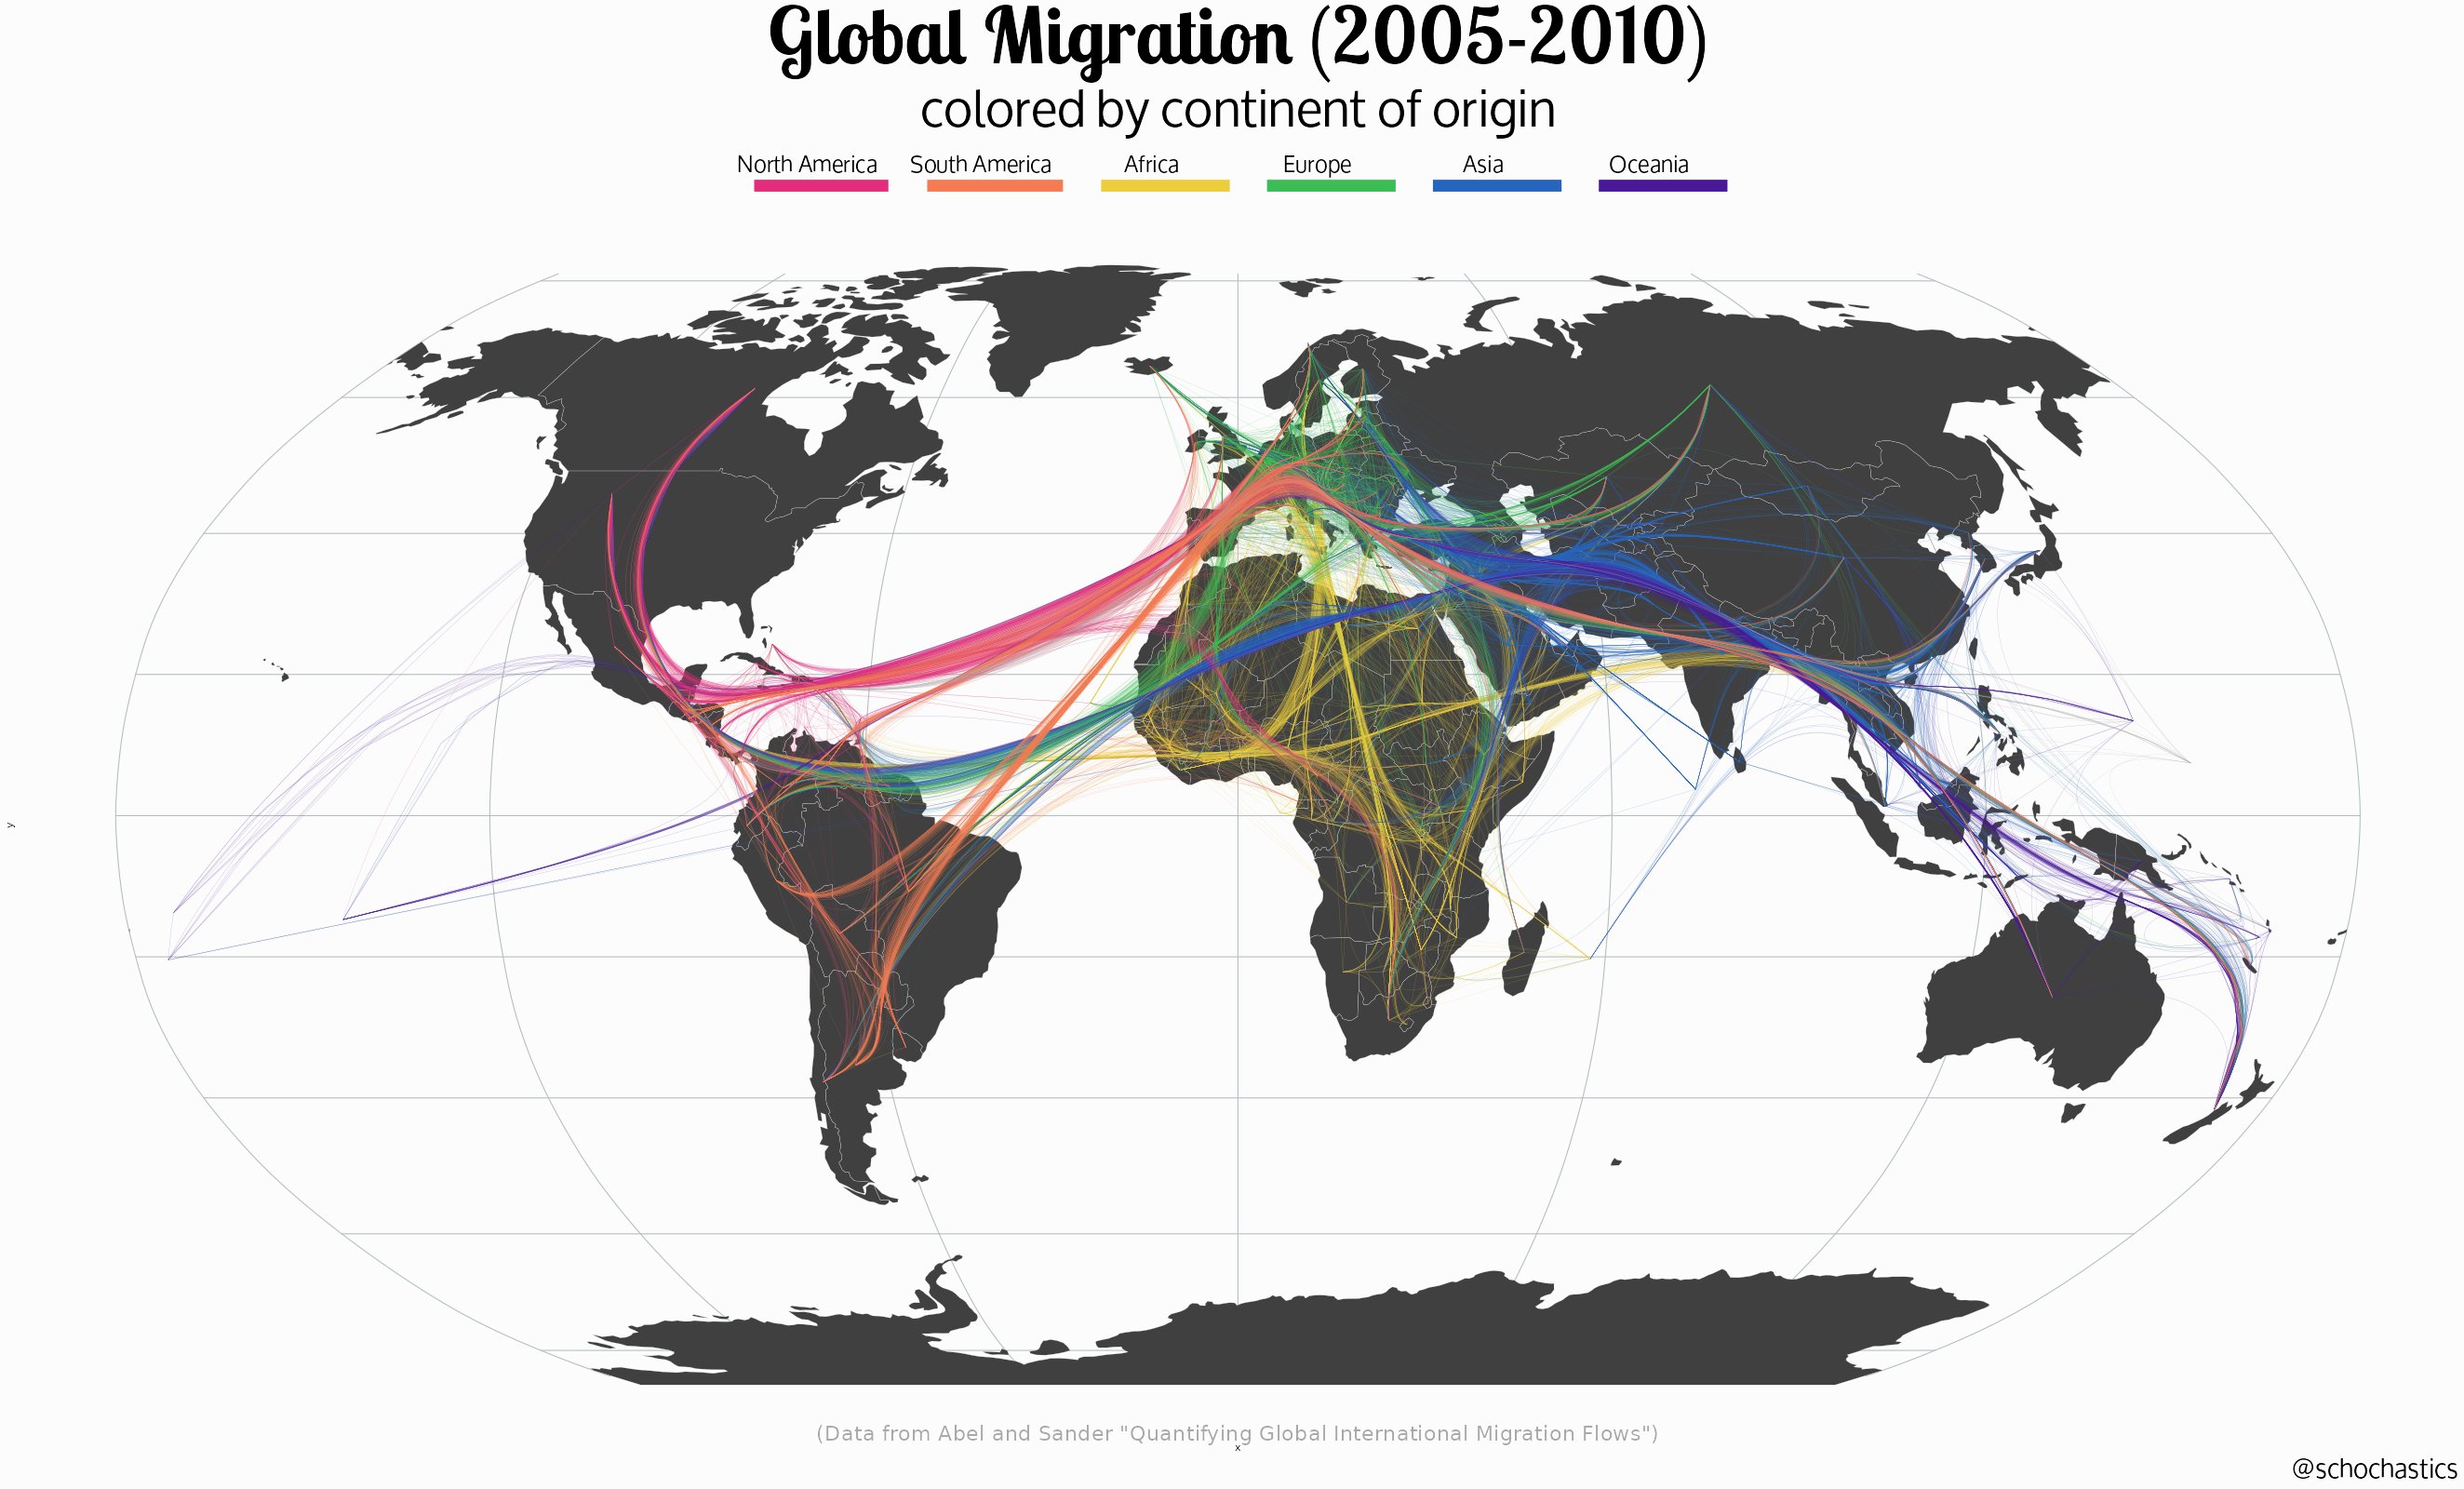
Source: @schochastics
More examples of flow maps can be found in this slide deck.