Word clouds (also known as tag clouds) were a very popular way of showing word frequencies in a corpus. In a world cloud the size of the text is proportional to the frequency of a word, and all words are arranged in a (usually) playful way. Text colour can be assigned randomly, or can be used to encode additional information. Before generating a word cloud, often occurring words like “the”, “of” and “then” or usually removed from the corpus.
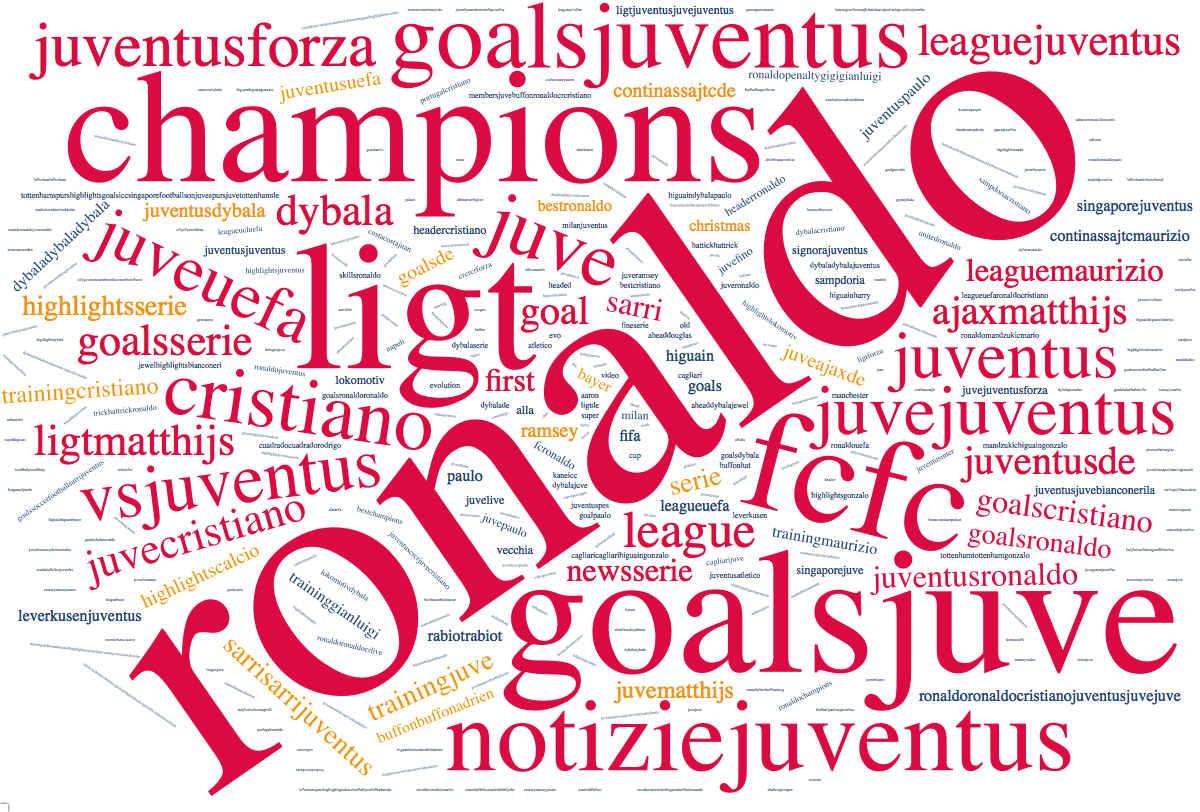
A word cloud showing the tags assigned to videos on the YouTube channel of football club Juventus FC. Source: Maarten Lambrechts
Although they certainly are engaging, word clouds have been criticised for various reasons.
- bar charts showing word frequencies are much more effective
- long words draw much more attention than short ones, even though they might have the exact same frequency
- no relationship between the words is shown
Researchers have tried to come with word cloud layout algorithms that can reveal deeper patterns in the words used in a text. Grouping and colouring words by topic is one suggested improvement.
Before grouping:
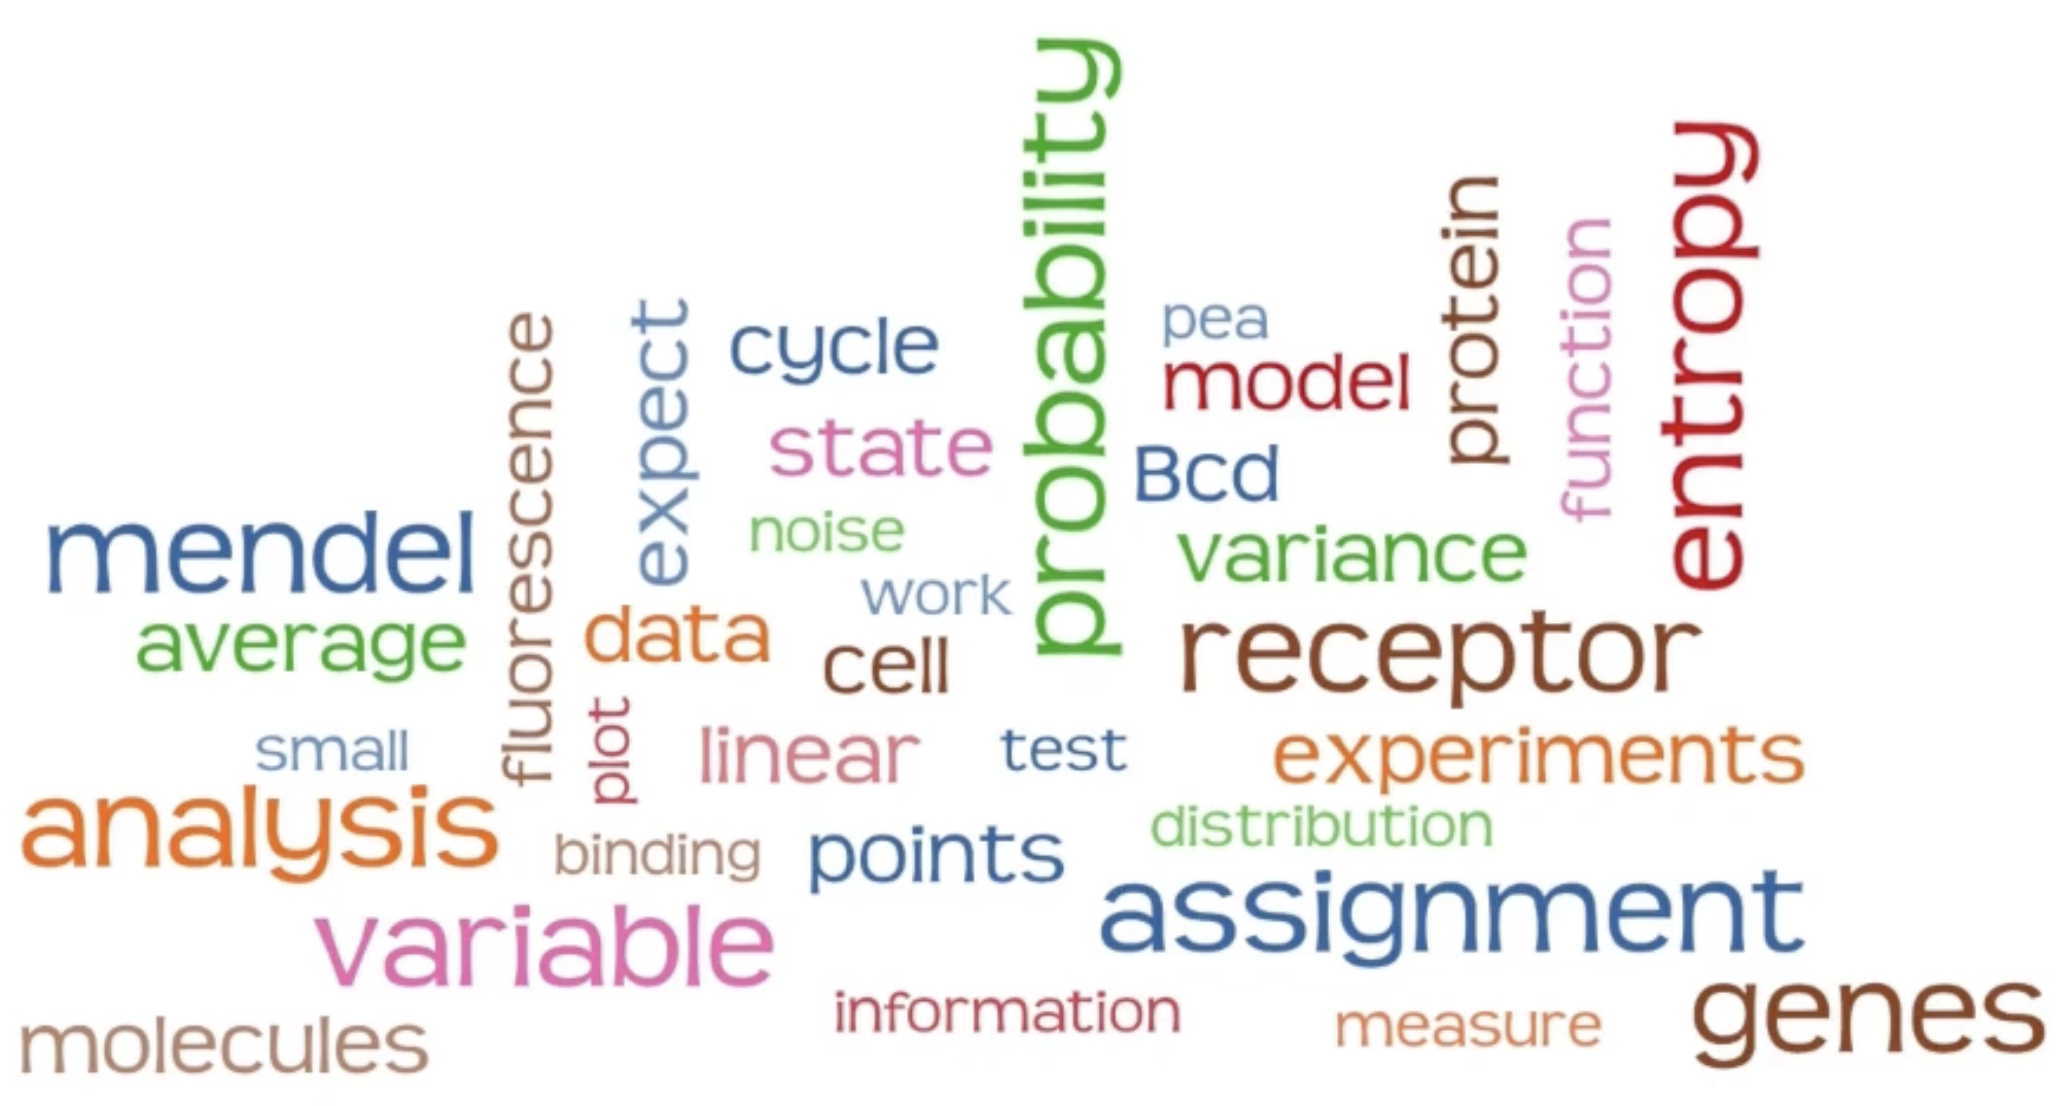
Source: An Evaluation of Semantically Grouped Word Cloud Designs
And after grouping, with horizontal text only:
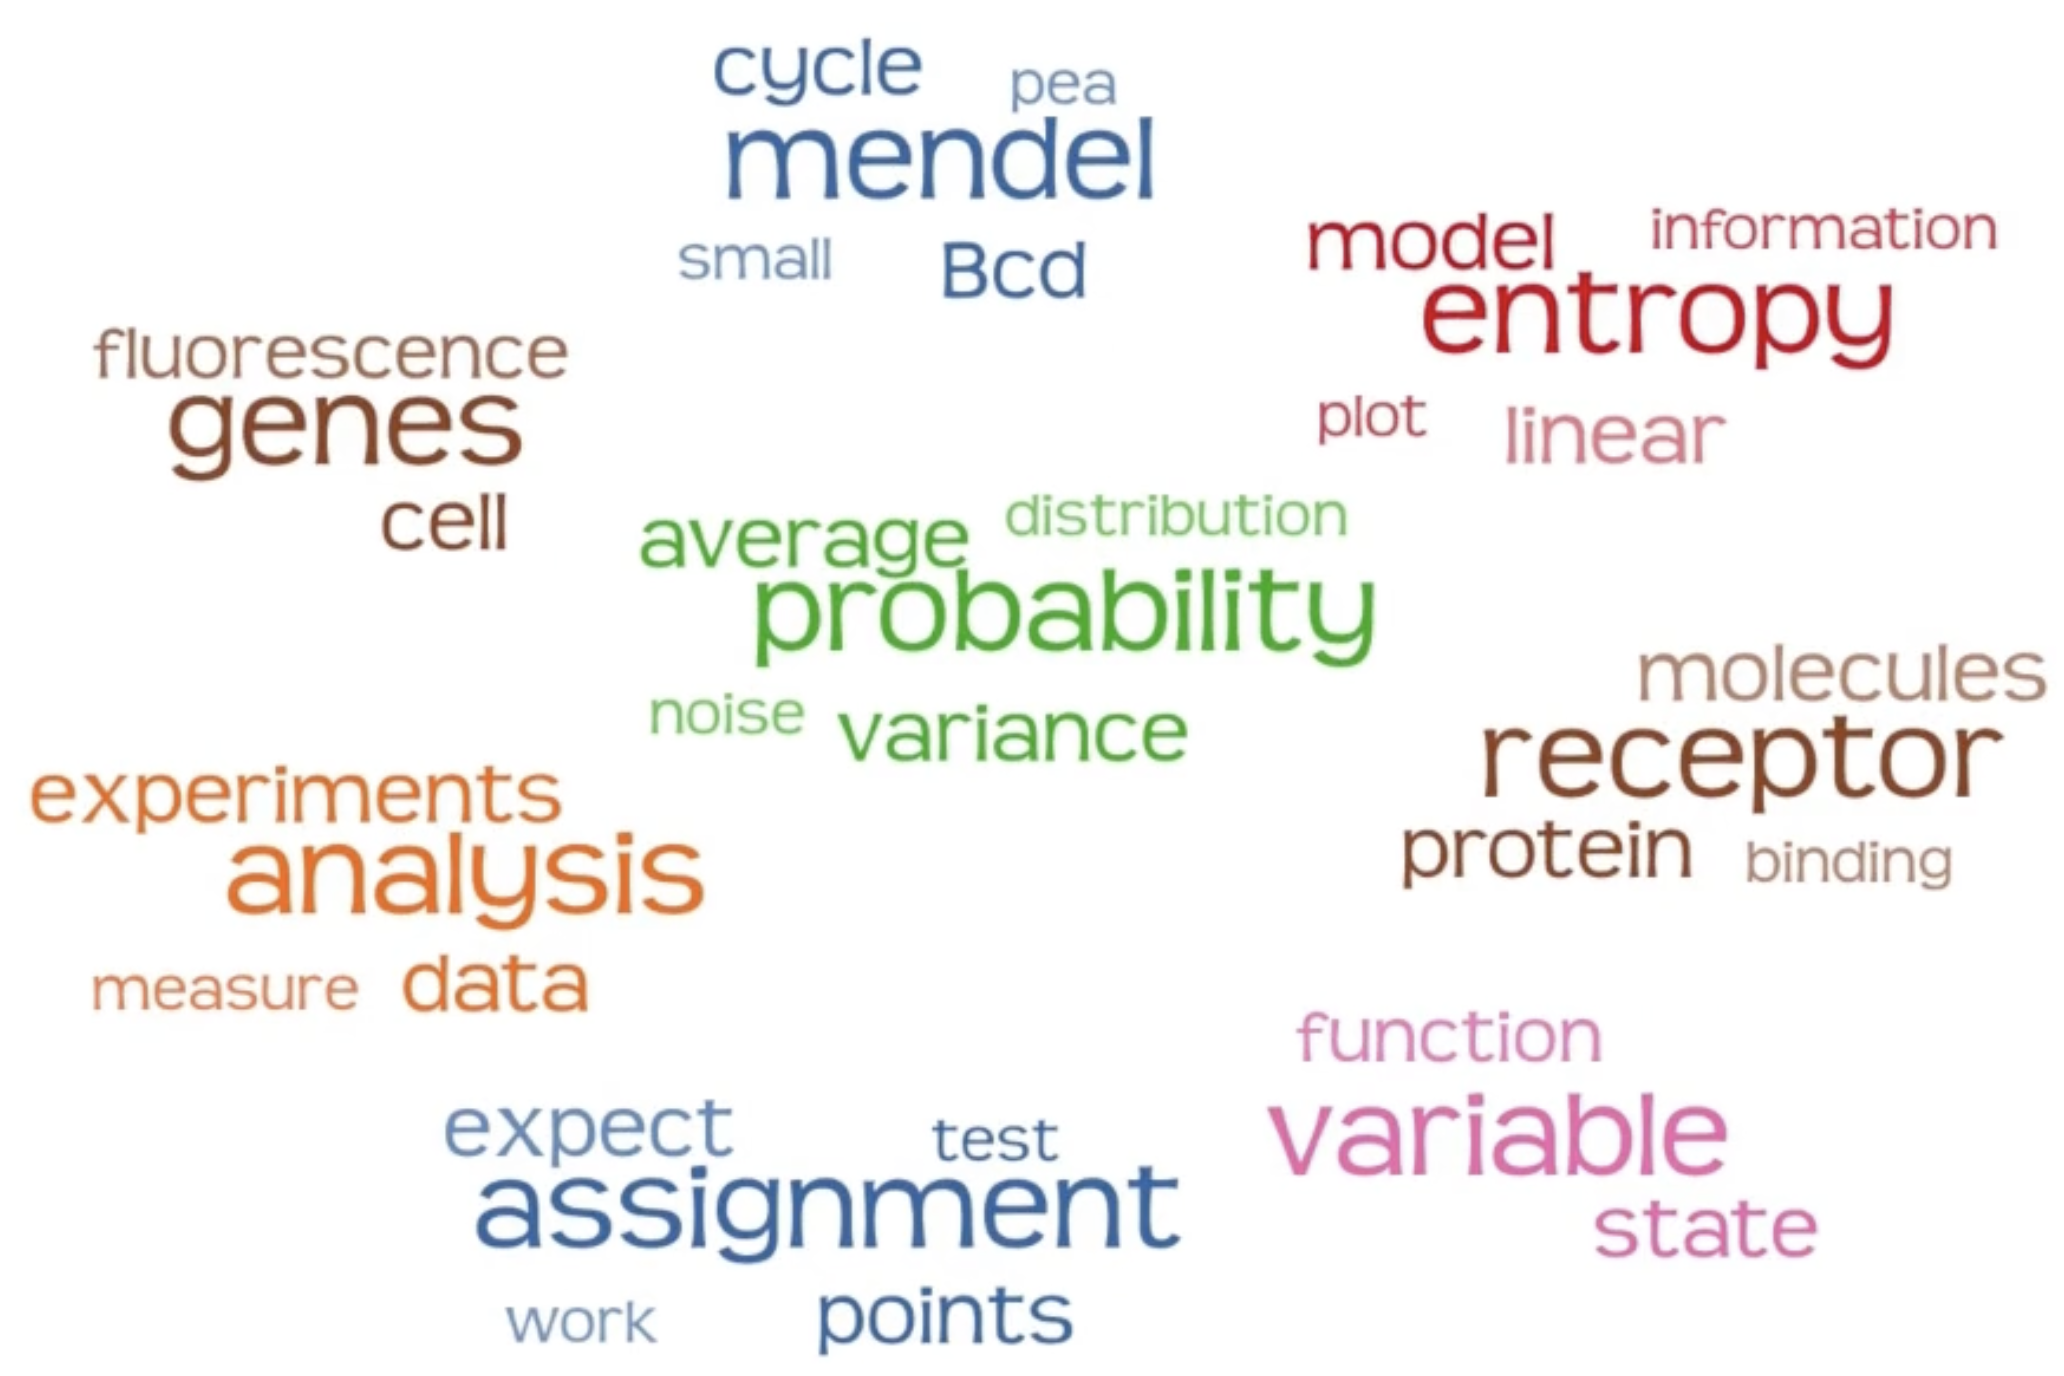
Source: An Evaluation of Semantically Grouped Word Cloud Designs
Instead of a word cloud, a stem-and-leaf plot can be used to show how many times words occur together in corpus. The example below shows the co-occurrence of adjectives with the characters in Grimm’s fairy tales.
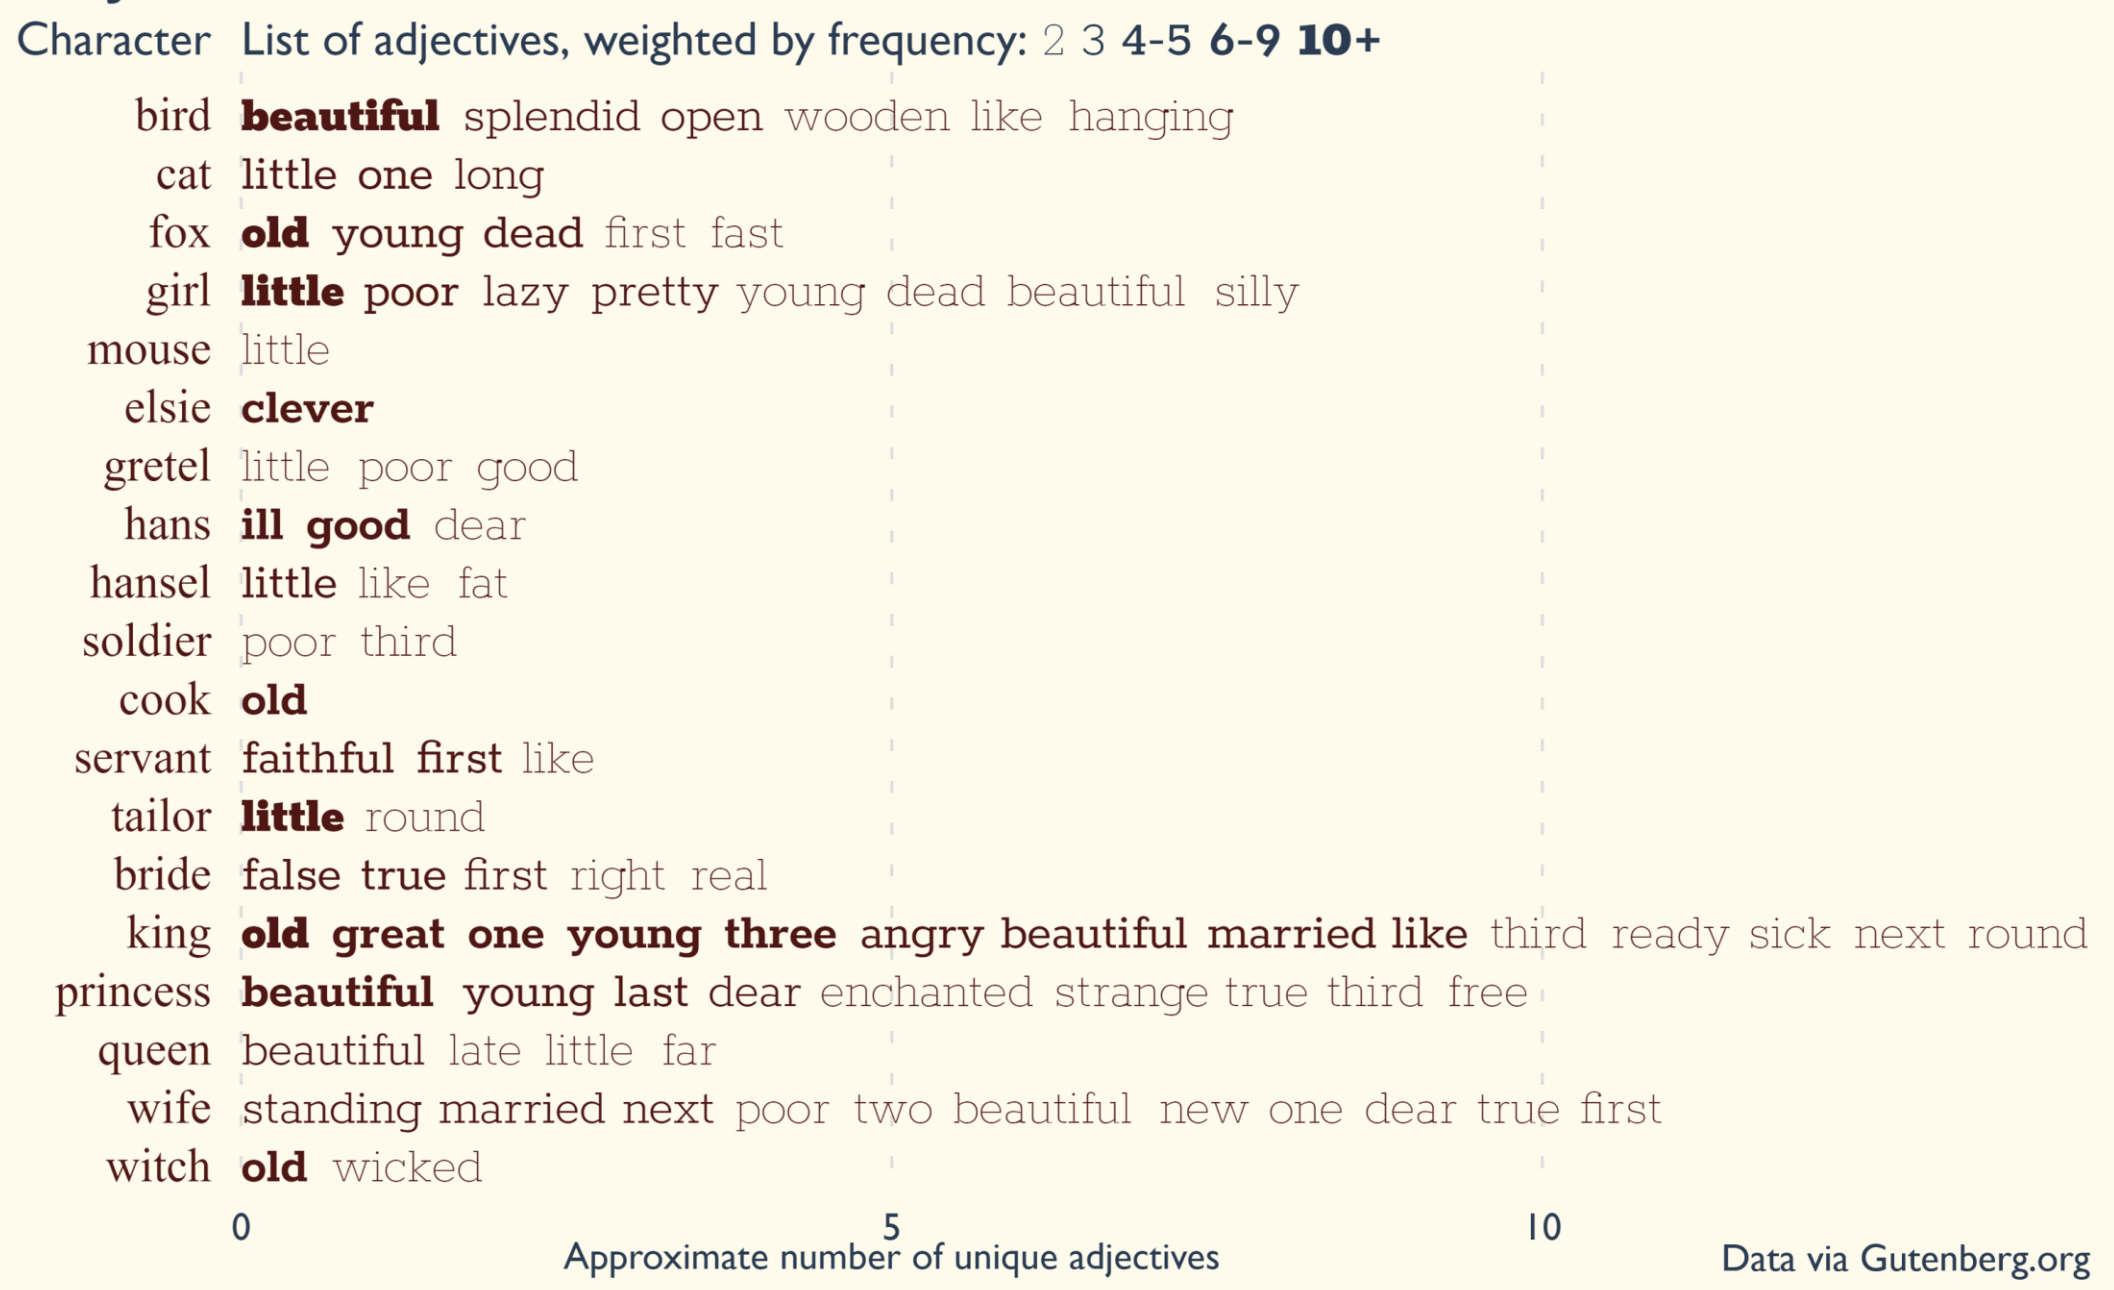
Source: Visualizing with Text, by Richard Brath