In stem-and-leaf plots, a set of numbers is first ordered. Then the leaves are separated from the stems of the numbers. The leaves are usually the last digits of the numbers and the stems are the other digits of the numbers. Then the stems are ordered on one side of the plot, plotting each stem only once. Stems that are missing should be filled in. Then the leaves are listed in increasing order on the other side of the plot. When the data contains duplicate numbers, the leaves should be plotted twice.
The stem-and-leaf plot below represents the numbers 20, 30, 32, 35, 41, 41, 43, 47, 48, 51, 53, 53, 54, 56, 57, 58, 58, 59, 60, 62, 64, 65, 65, 69, 71, 74, 77, 88 and 102. Notice that the stem “9” is missing, and filled in on the left of the plot, and that the numbers 41, 53, 58 and 65 occur twice in the data as well as in the plot.
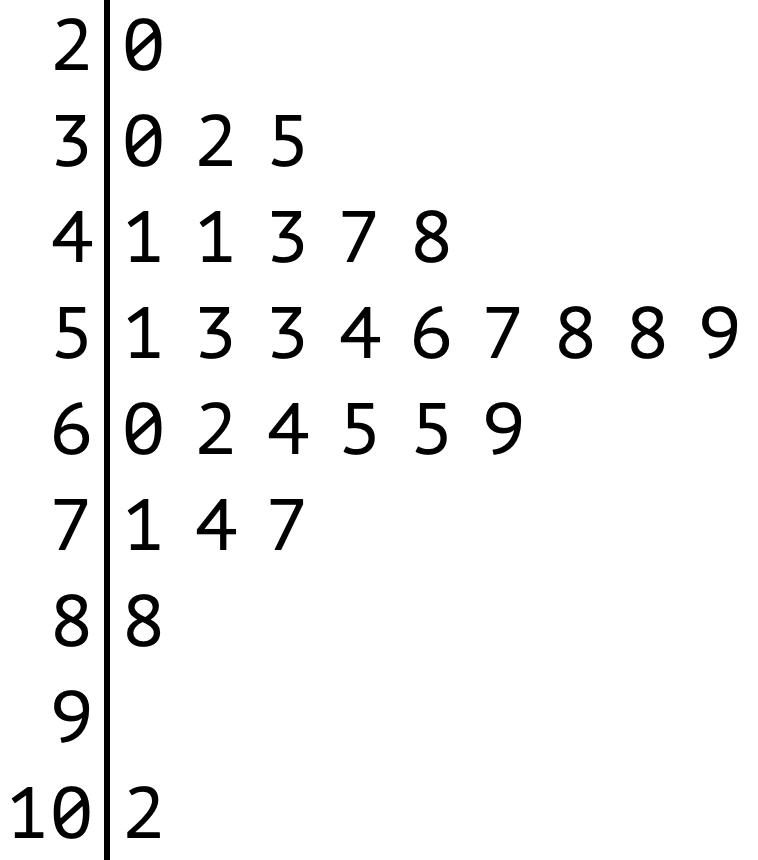
Source: Maarten Lambrechts, CC BY SA, 4.0
The resulting plot is very similar to a histogram: it is ease to identify clusters in the data (in this case many data points are between 50 and 60) and that there are two outliers, each on one side of the distribution (20 and 102).
To not distort the shape of the emerging histogram, it is important to evenly space out the leaves of the plot. When simply using a string to generate the stacked leaves, you should make sure to use a monospaced font, in which all number characters have the same width.
Stem-and-leaf plots are sometimes used to communicate the schedule of public transport stops. In that case the hours form the stems and leaves are the minutes a train or bus is supposed to pass by a stop.
In the schedule below, you can clearly see that during the week there are more trains during rush hours, while these additional trains do not run during the weekends.
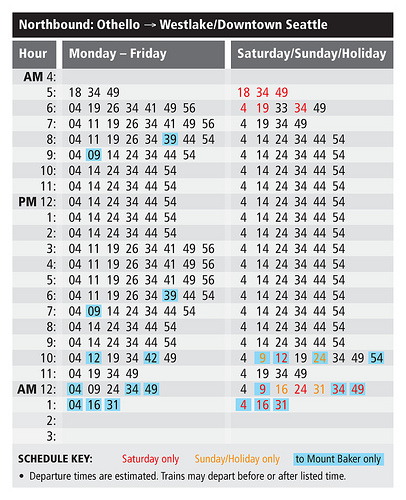
Source: ylgarris.wordpress.com