Many of the examples of visualisations that use text do more than just arranging text to let patterns emerge from a data set. Many also use text properties like font size, font weight and colour to encode additional dimensions of the data.
Let’s return to the stem-and-leaf plot like visualisation that arranges the US states code according to poverty rate in each state.
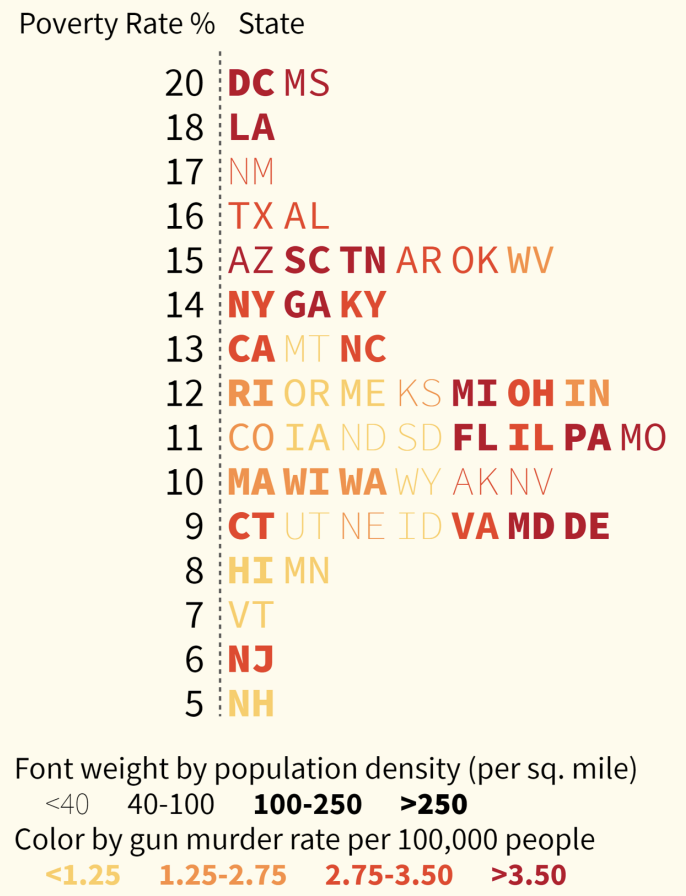
Source: Visualizing with Text, by Richard Brath
The legends below the plot explain how the font weight and colours are used to encode additional dimensions in the plot: a higher font weight means a higher population density, and a darker colour means a higher gun murder rate.
In his book Visualizing with Text, Richard Brath shows that text has a much wider palette of visual attributes than traditional visual elements like circles, bars and lines have. In the figure below, the top row contains the visual attributes that are shared between text and traditional visual elements. The bottom row shows the visual attributes that are exclusive to text.
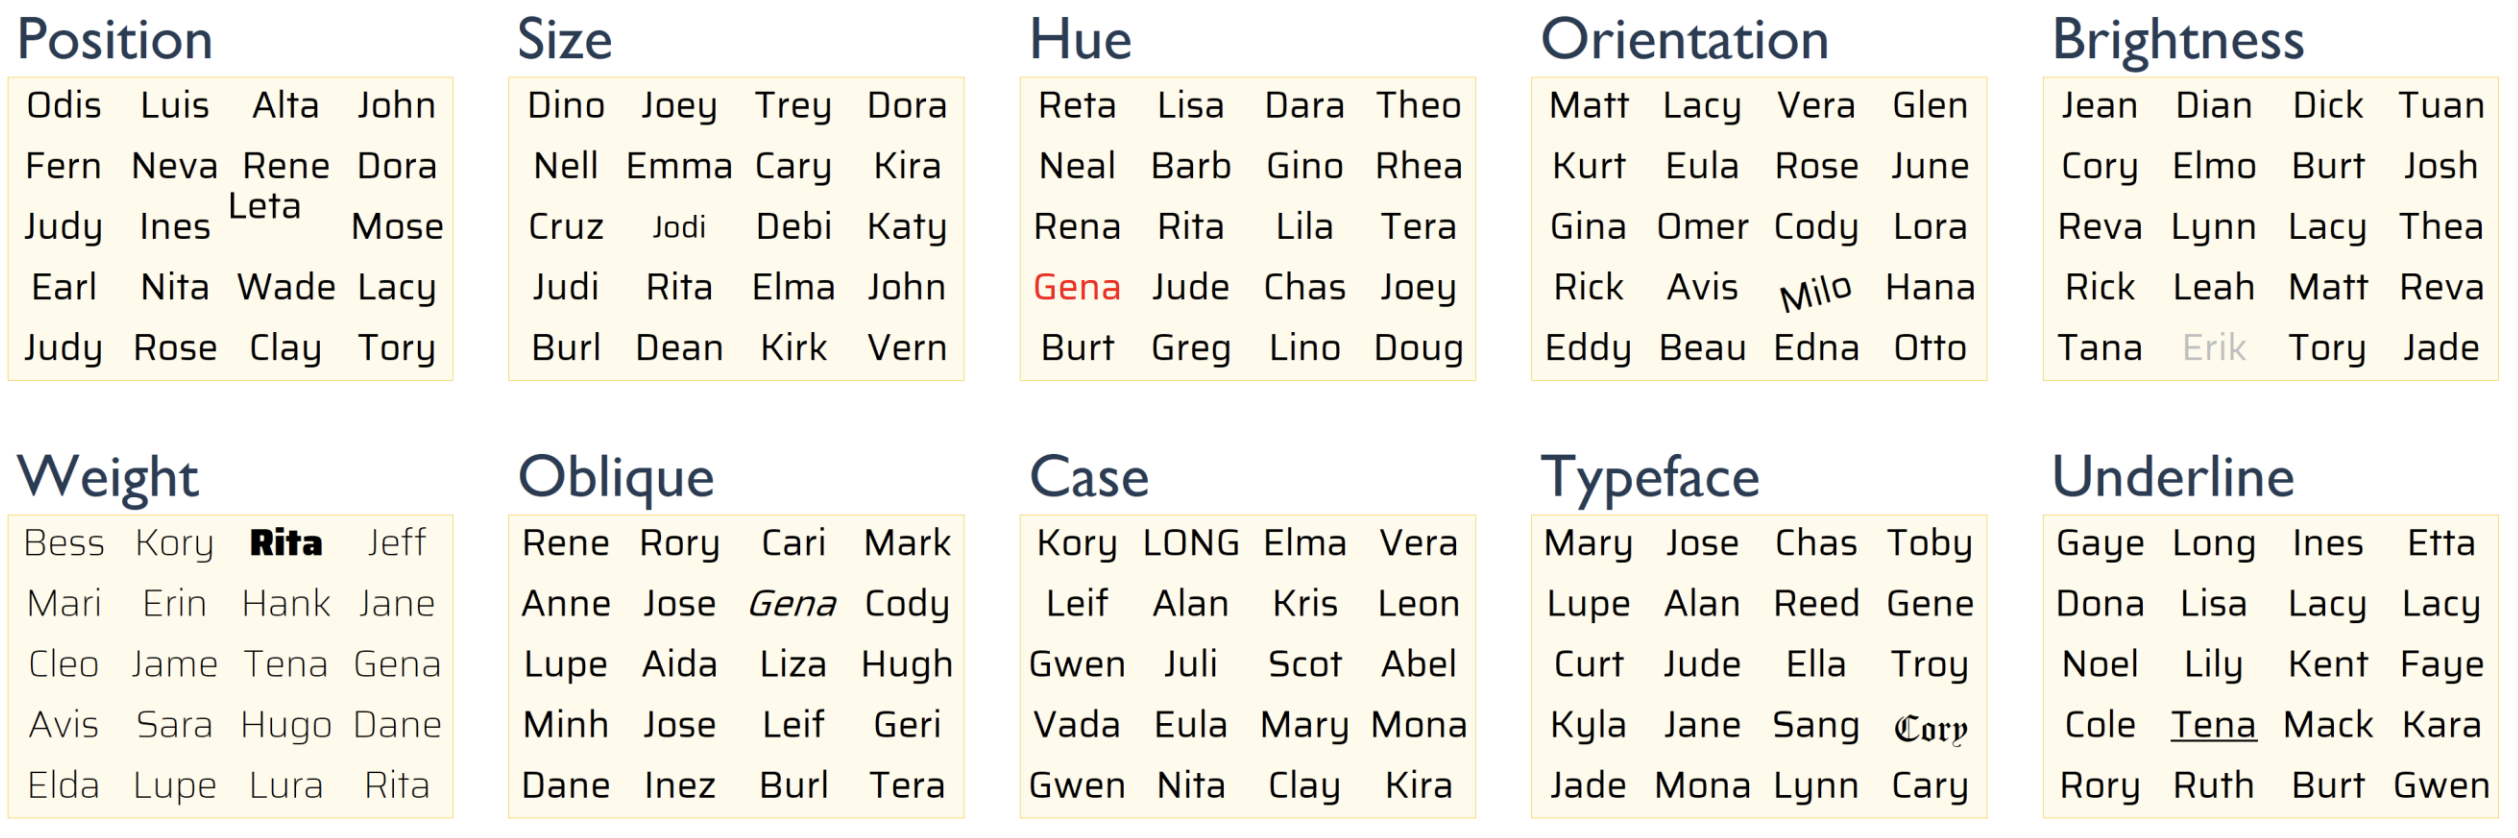
Source: Visualizing with Text, by Richard Brath
The plot below uses text colour in a smart way. It shows the sex ratio of workers in the sectors of the American economy by colouring parts of the name of the sector in purple for the share of women active in the sector, and in green for the share of men.
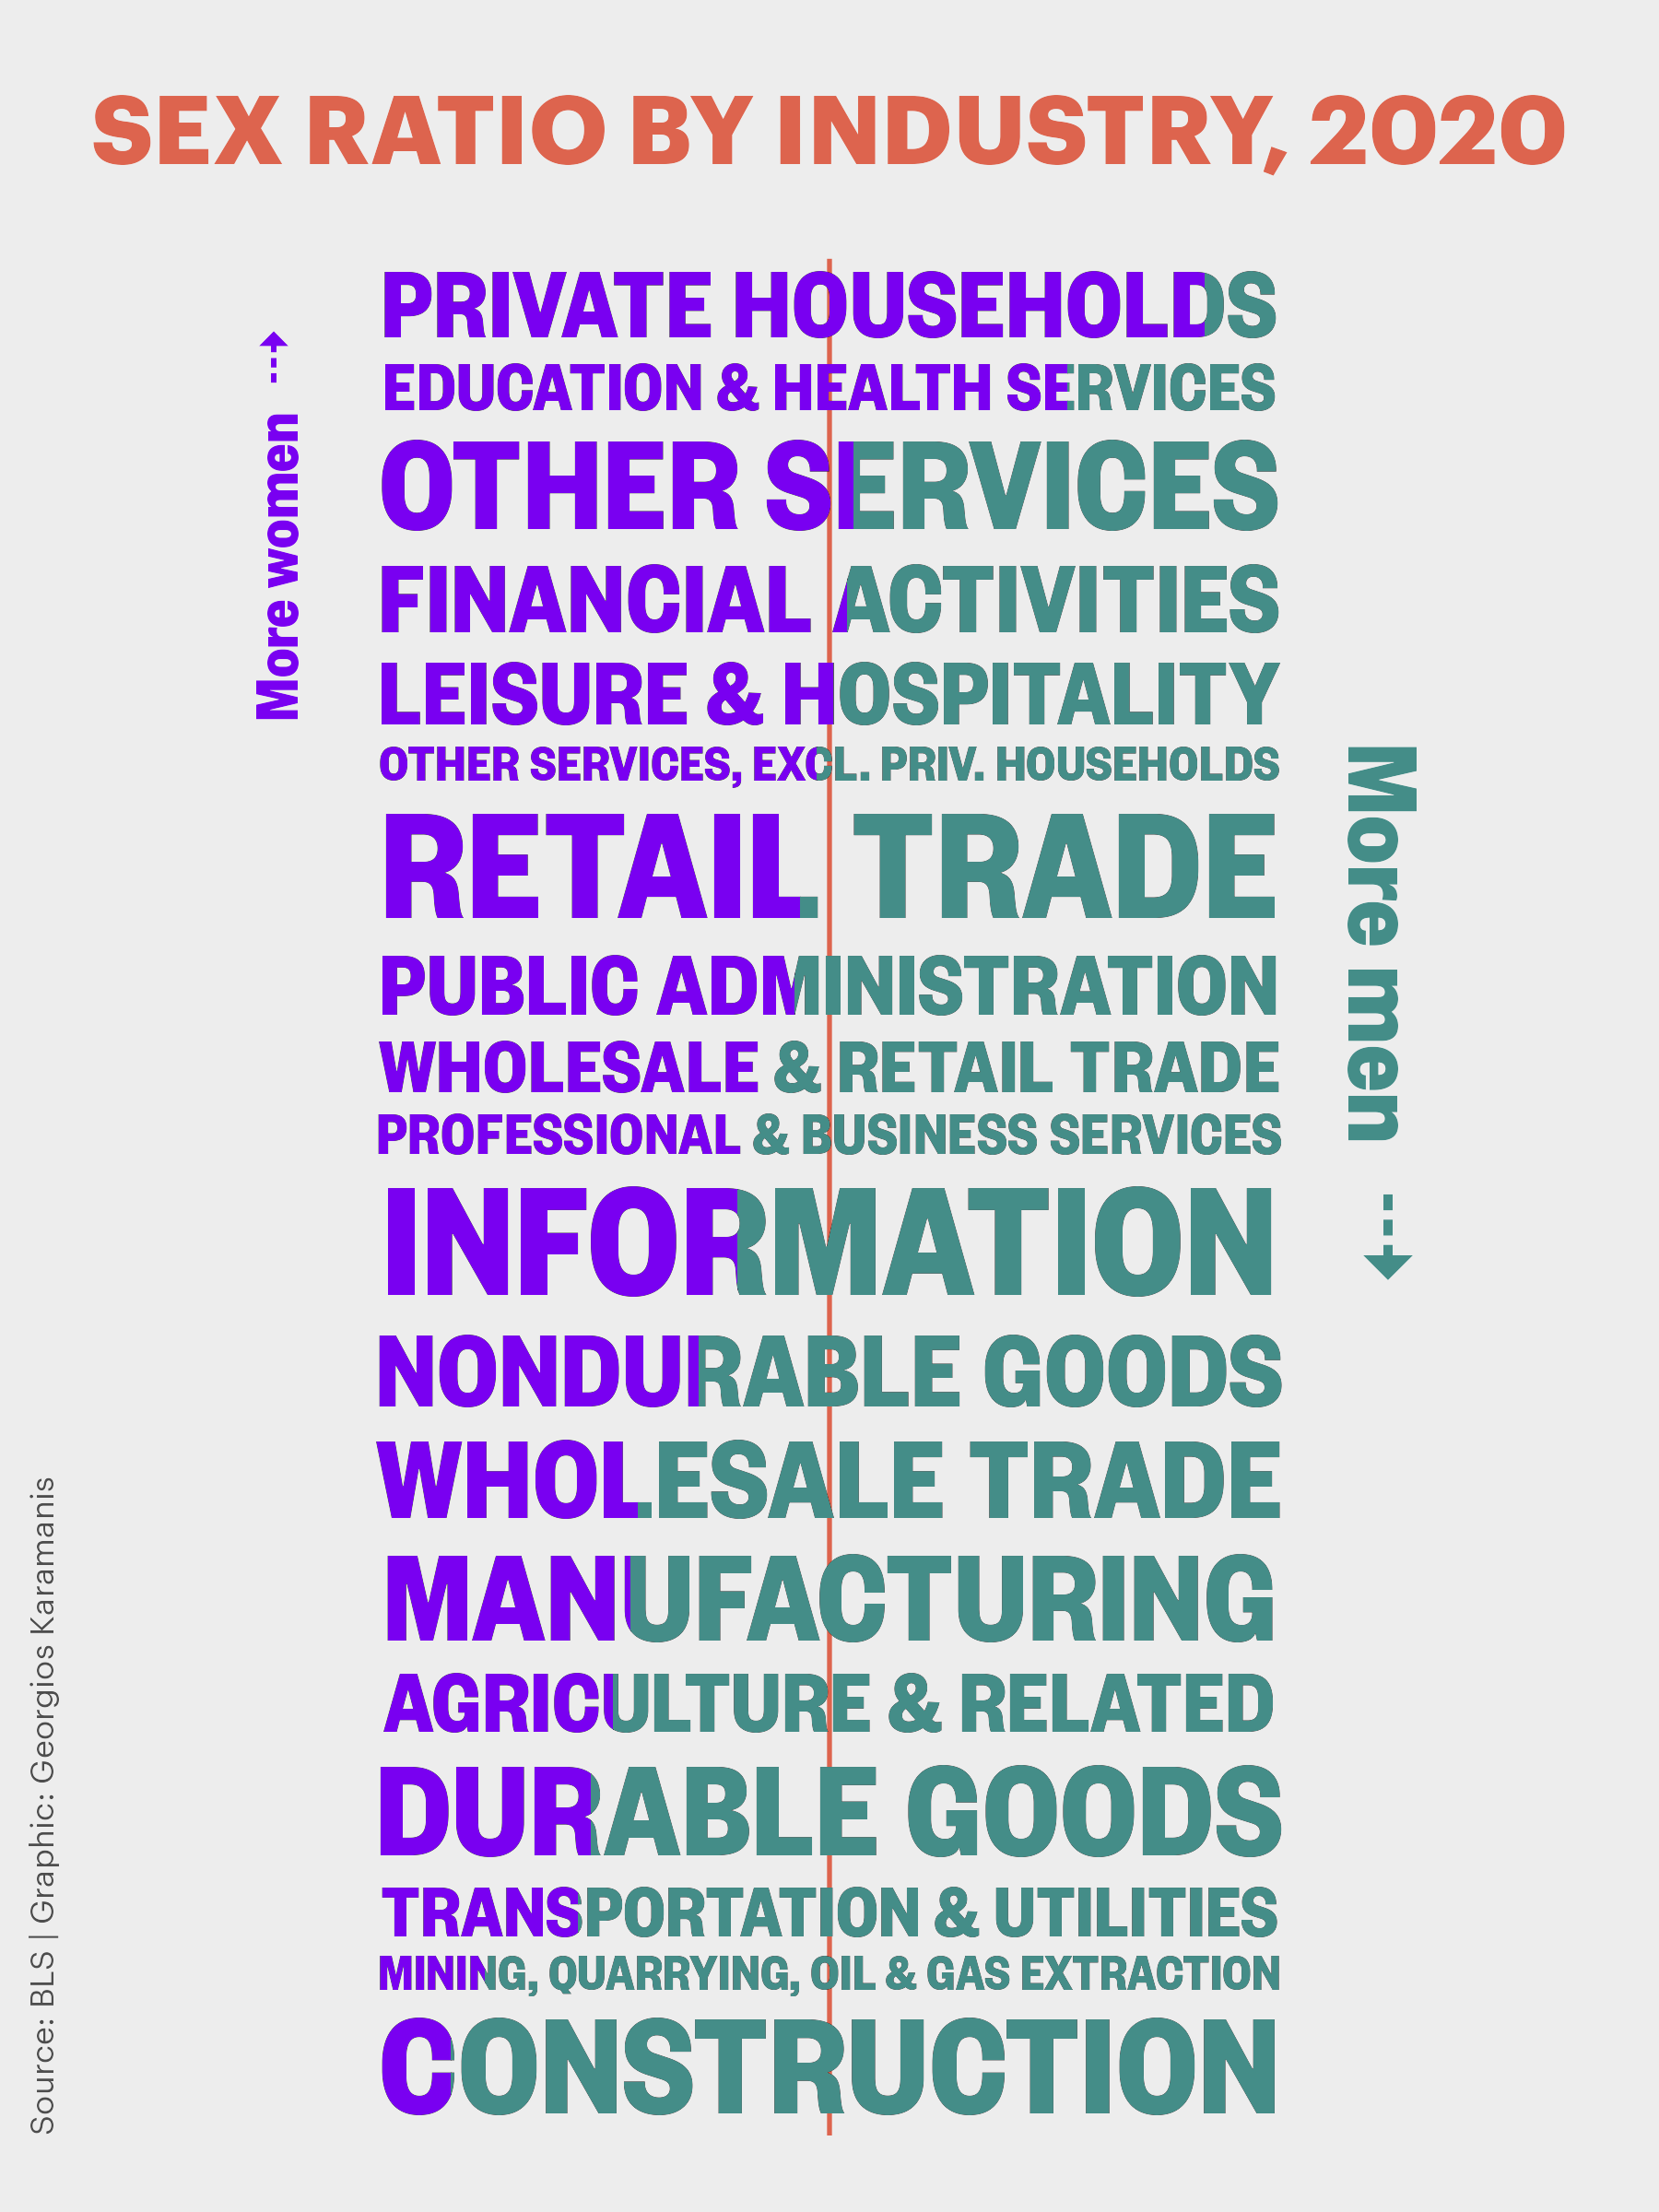
Source: @geokaramanis
In the visualisation above, the font size is determined by the number of characters in each sector name (names with less characters have a larger font size to make them fit). An extended version of this chart could map the font size of the sectors to the share of each sector in the total economy.
Below is another example of a “text stem-and-leaf plot”, showing data about sectors in the Standard & Poor’s index. This time, additional data is encoded in the colours and the casing of the sector codes. Sectors with negative values have white text on a coloured background, while sectors with positive values have the colours applied to the text itself. Lower case text means low volatility, upper case means high volatility.
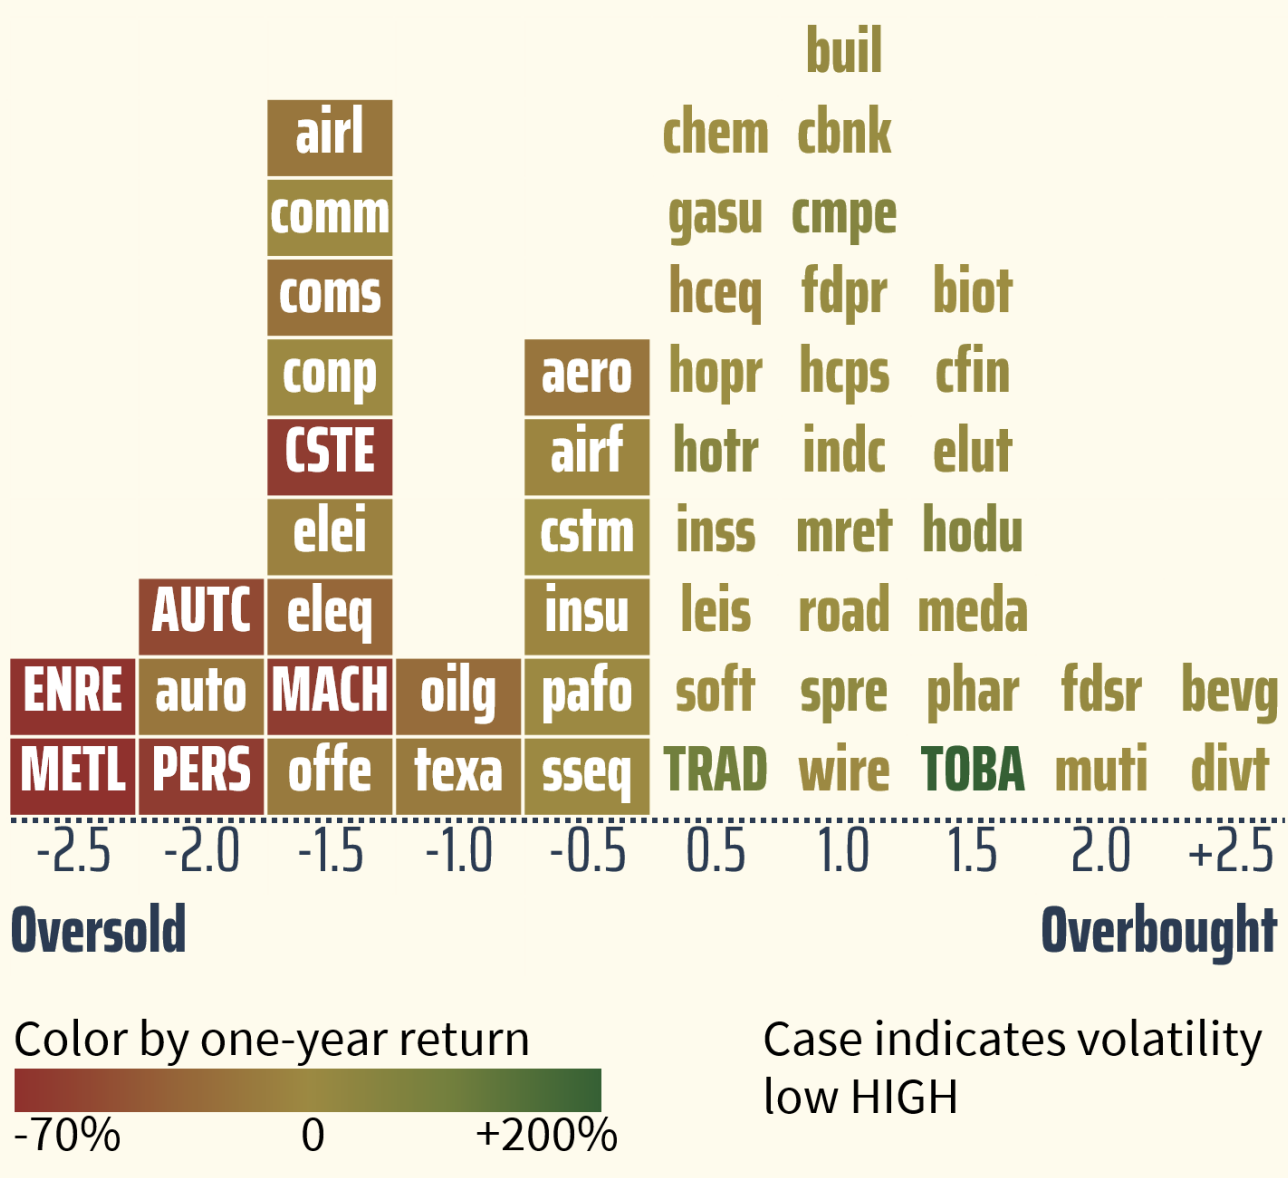
Source: Visualizing with Text, by Richard Brath