In Inaugurate, the content of the speeches of 12 US presidents are compared and analysed for the occurrence of specific terms. Tooltips reveal parts of the speeches that contain the terms.
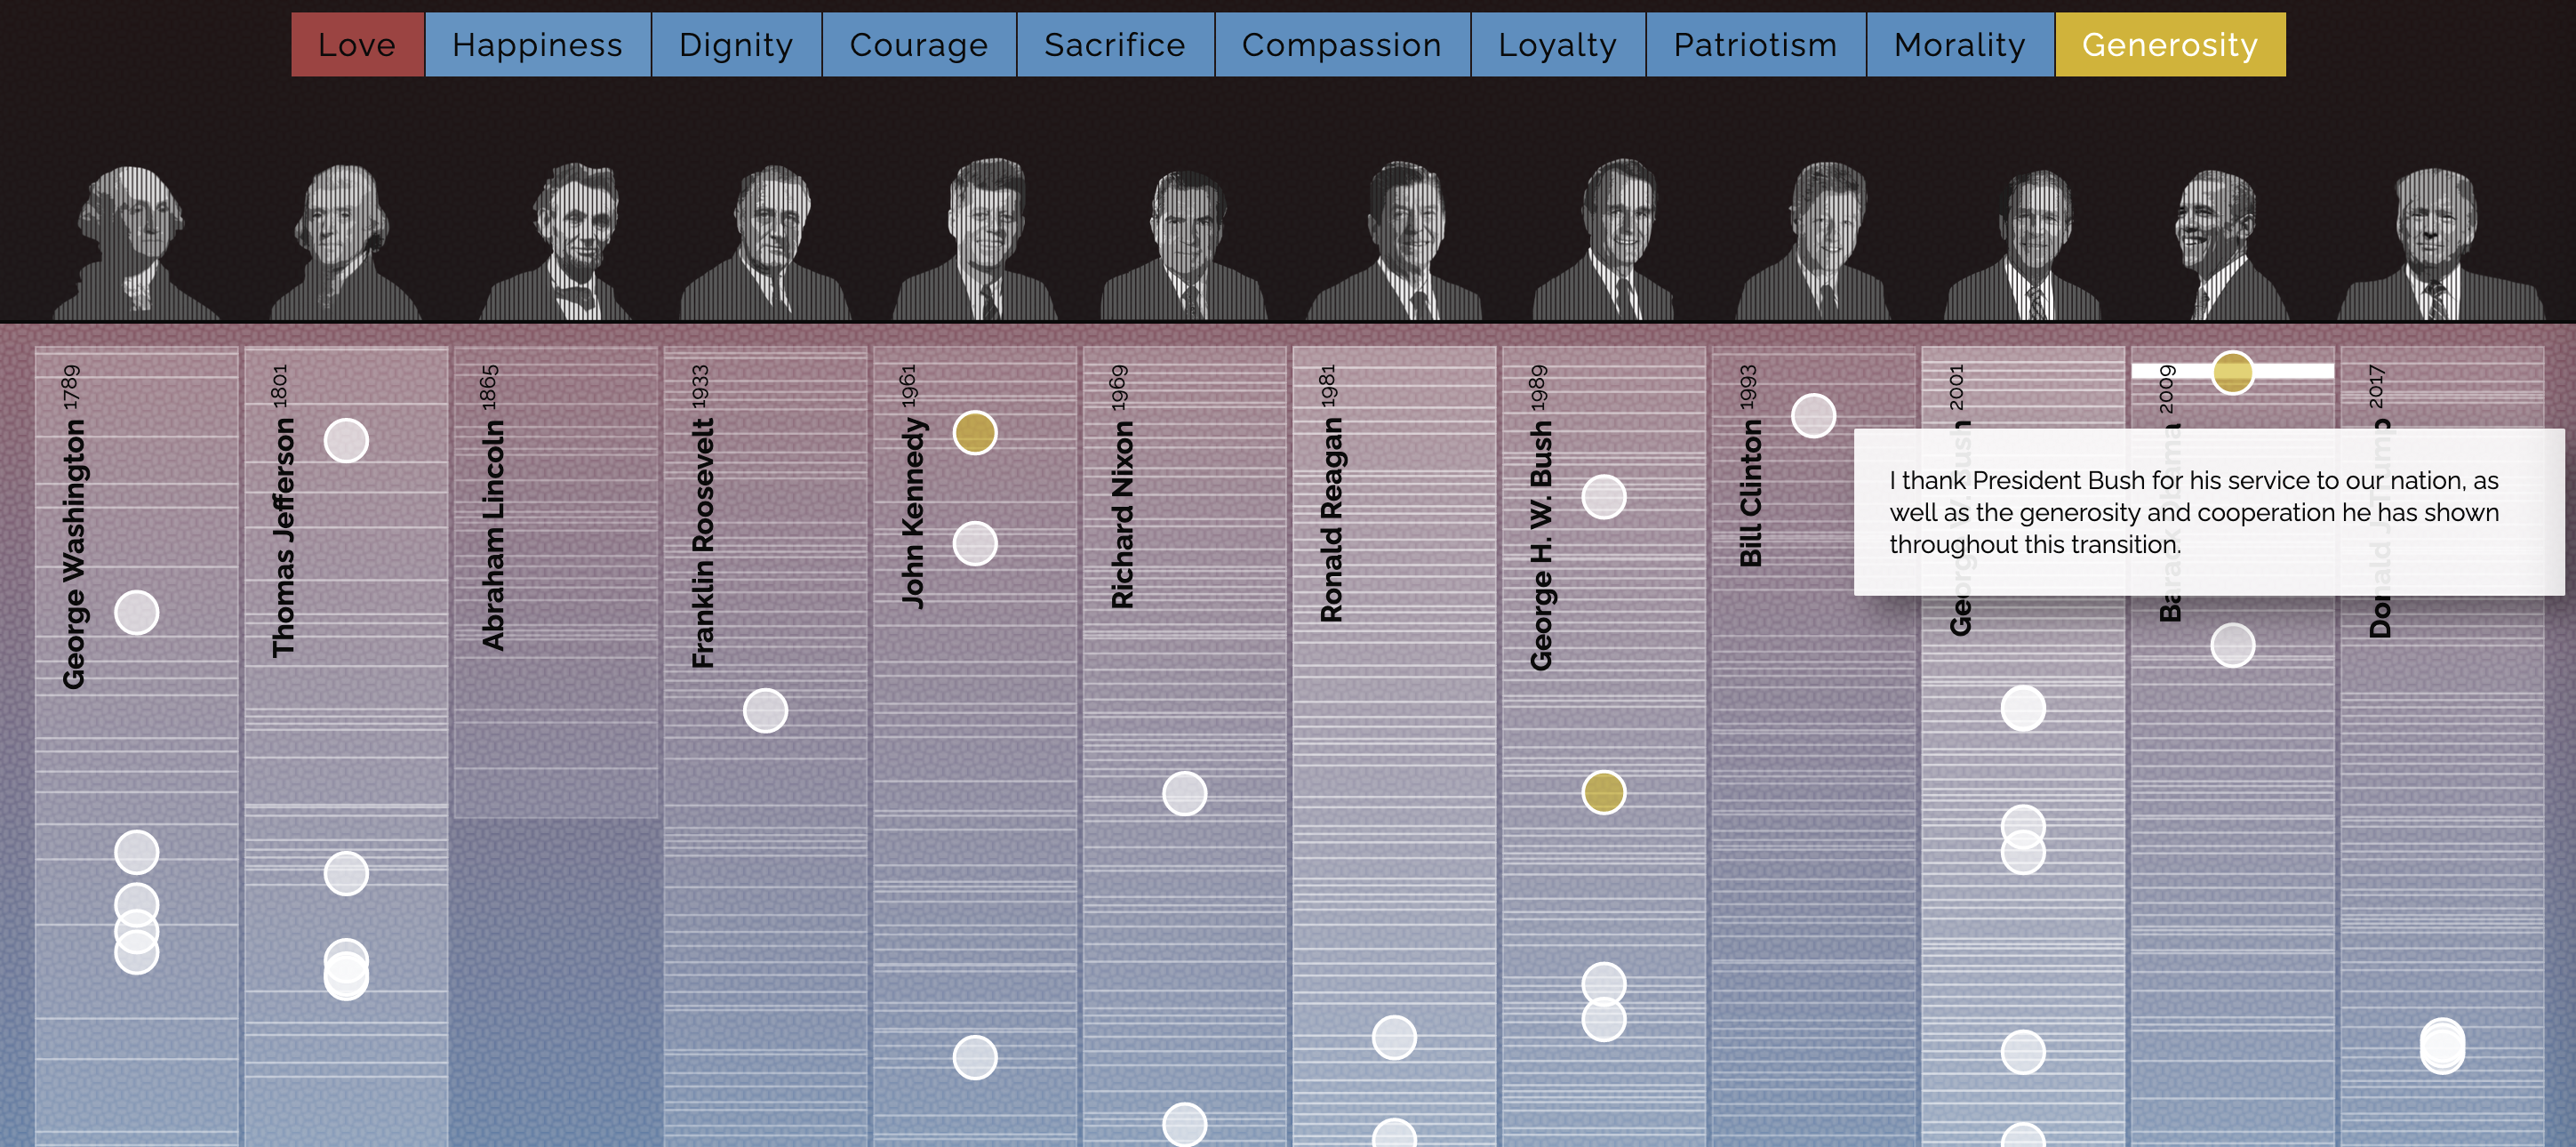
Source: Inaugurate
When the focus is on topics and emotions in text, a technique that is sometimes used is to highlight parts of the analysed text on “little pages” and pull some quotes from the text for illustration.
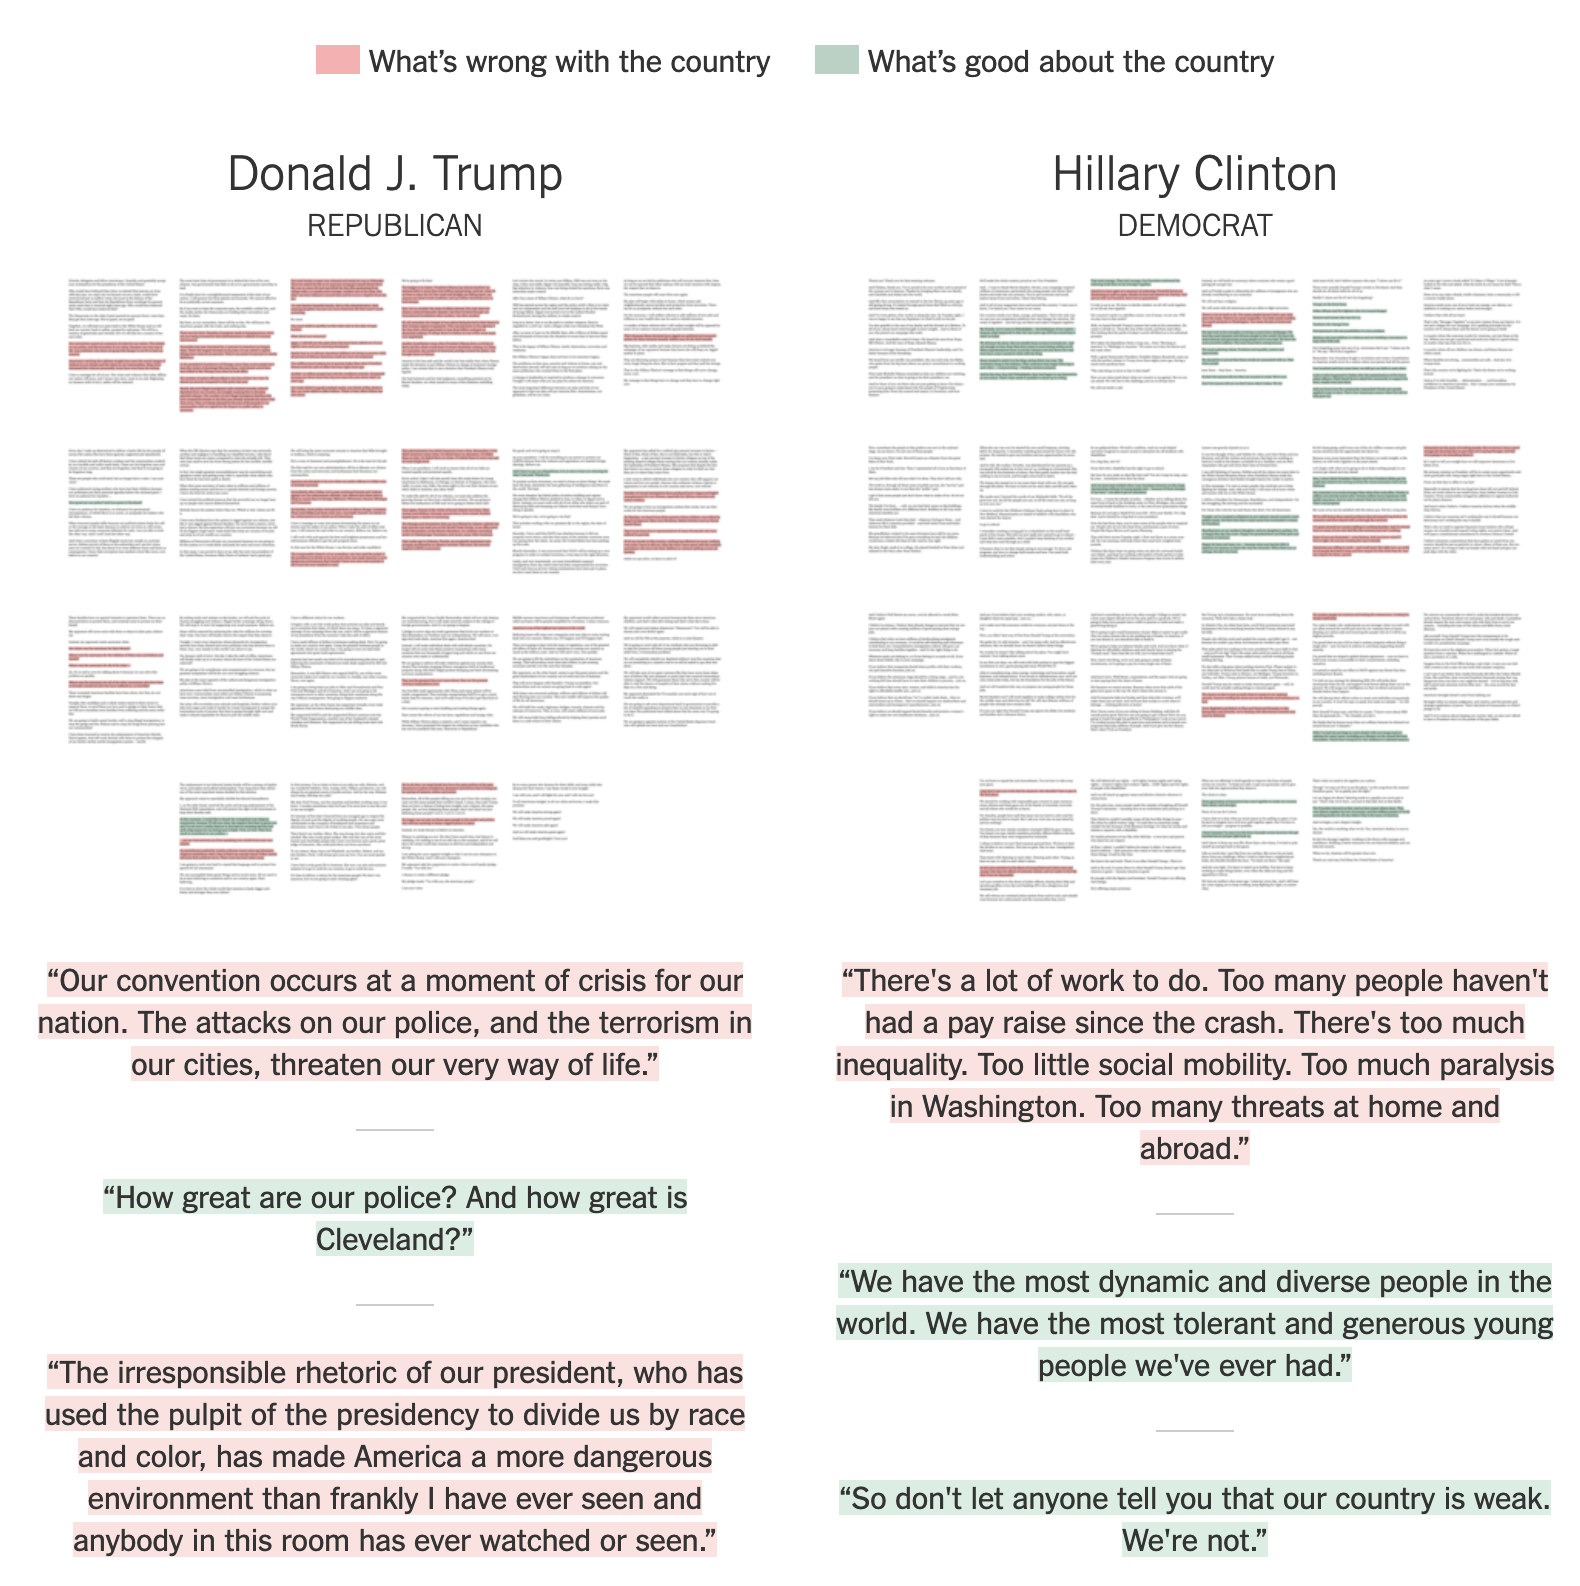
Source: ‘Stronger Together’ and ‘I AmYour Voice’ — How the Nominees’Convention Speeches Compare
More examples of examples of text visualisation techniques can be found in the Text Visualization Browser, and in the replies to this tweet by Tiziana Alocci