Sometimes it is not the correlation or the absolute values of 2 time series that are important, but the differences between them. In those cases it makes sense to highlight the difference.
This technique is applied to one of the first line charts ever made. It was published by Scottisch engineer William Playfair at the end of the 18th century, and it shows the imports and exports between England on one hand and Denmark and Norway on the other.
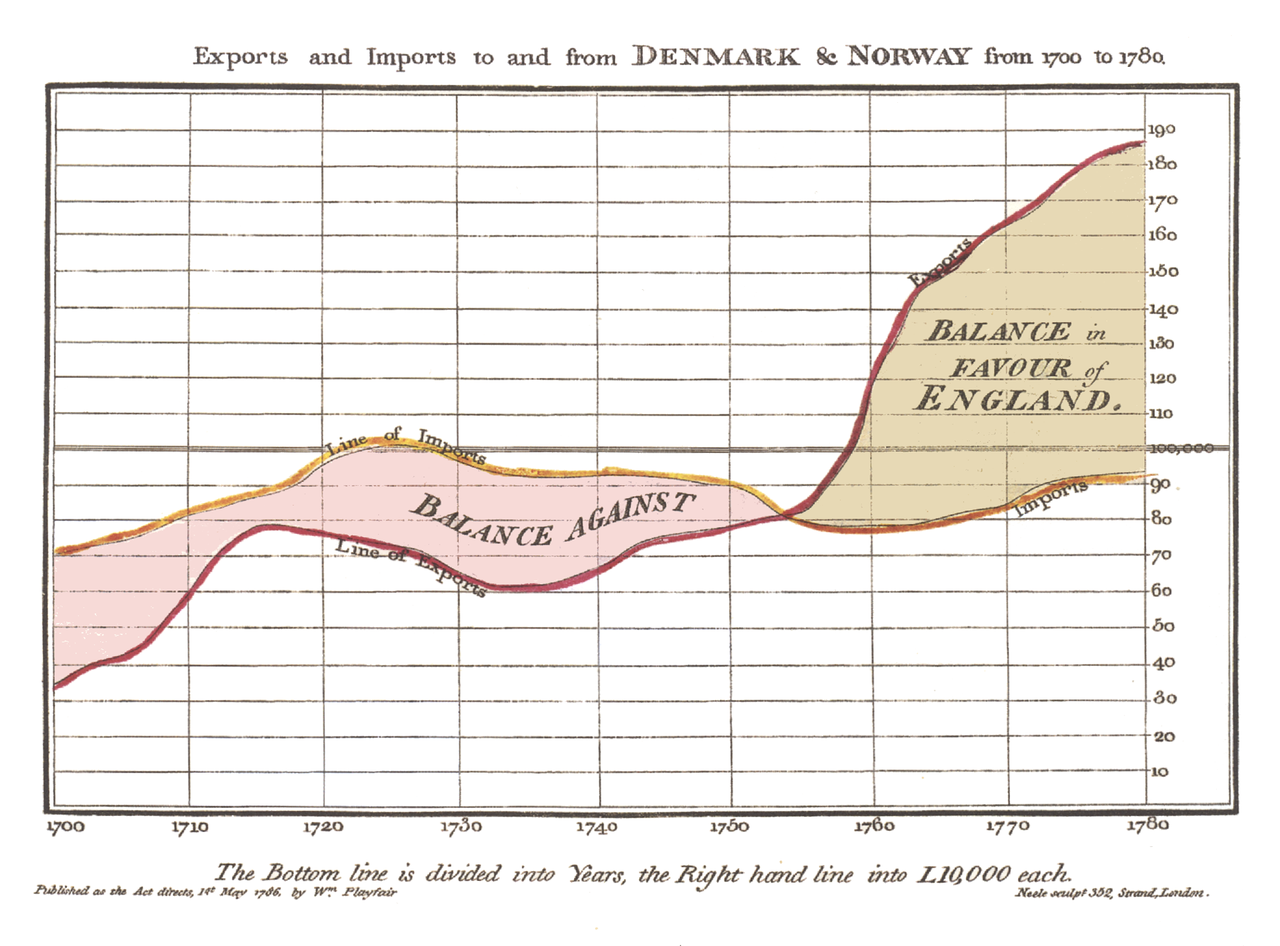
Source: William Playfair, public domain
The difference between the imports and exports is the trade balance, and by using colour and bold text annotations, Playfair managed to show when the balance was against England and when it was in favour of it.
For stock traders, the monitoring of prices of stocks is really important. Especially price differences, like between the opening and closing price or between the highest and lowest price on each day, are important information. Candle stick charts can show all this information in a single graph, which makes them a popular chart type in the financial world.

Source: datavizcatalogue.com/methods/candlestick_chart.html
On a candle stick chart, the thin whiskers indicate the spread between the highest and lowest prices during the day. The coloured bars show the difference between the opening and closing price for each day, with the colour indicating which of the two was the highest.