Despite the flexibility that the Grammar of Graphics offers with different geometries, different aesthetics, data transformations, scale configurations and the possibility to layer geometries on top of each other, the Grammar has its limits. Or better put: the implementations of the Grammar of Graphics have their limitations.
Non-cartesian coordinates
For example, none of the 3 implementations have simple and out-of-the-box solutions for ternary plots.
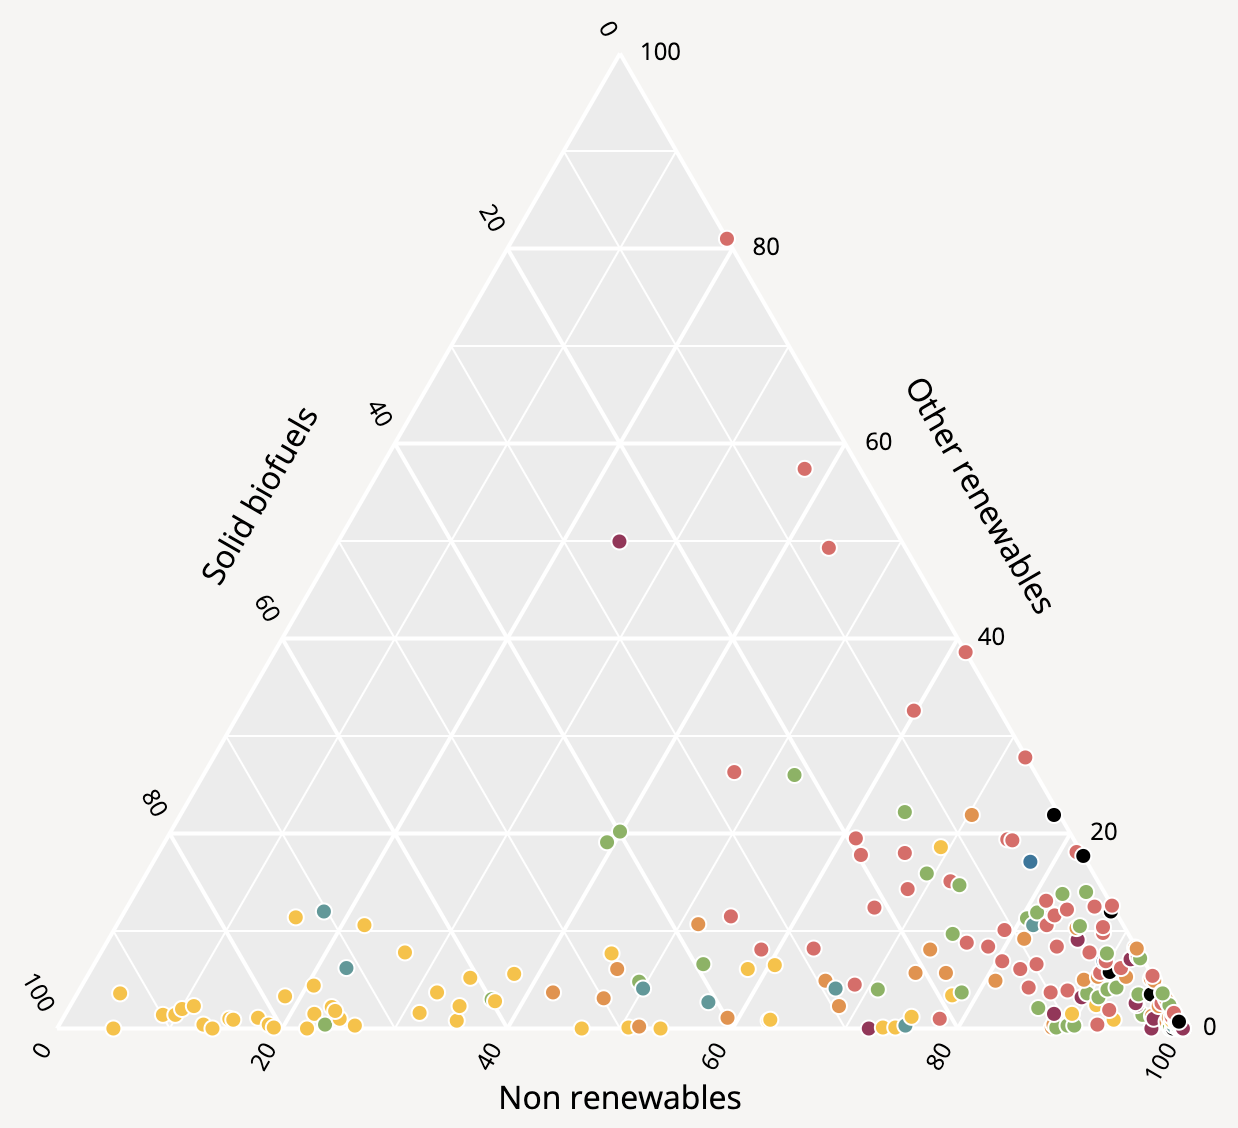
This ternary plot shows the the composition of the sources of household energy consumption in different countries. Values can be read from each of the 3 axes. Source: Maarten Lambrechts, CC BY SA 4.0
The reason this chart type is not supported well by the implementations of the Grammar of Graphics, is that it is not using a cartesian coordinate system, with 2 perpendicular x and y axes, but instead uses a triangular coordinate system (called a barycentric coordinate system).
With some transformations on the data, the barycentric coordinates can be calculated and transformed into cartesian coordinates, after which something like a ternary plot can be generated with any of the implementations of the Grammar. But there is no straightforward way to produce a ternary plot in the implementations.
Polar coordinates
Support for polar coordinates differs between the 3 implementations. In ggplot2, all plots can be switched from using the default cartesian coordinate system to using a polar coordinate system. For example, a pie chart is constructed in ggplot2 by making a stacked bar chart and switching to the polar coordinate system.
ggplot(data = mtcars, aes(x = factor(1), fill = factor(cyl))) +
 geom_bar(width = 1)+
 coord_polar(theta = "y")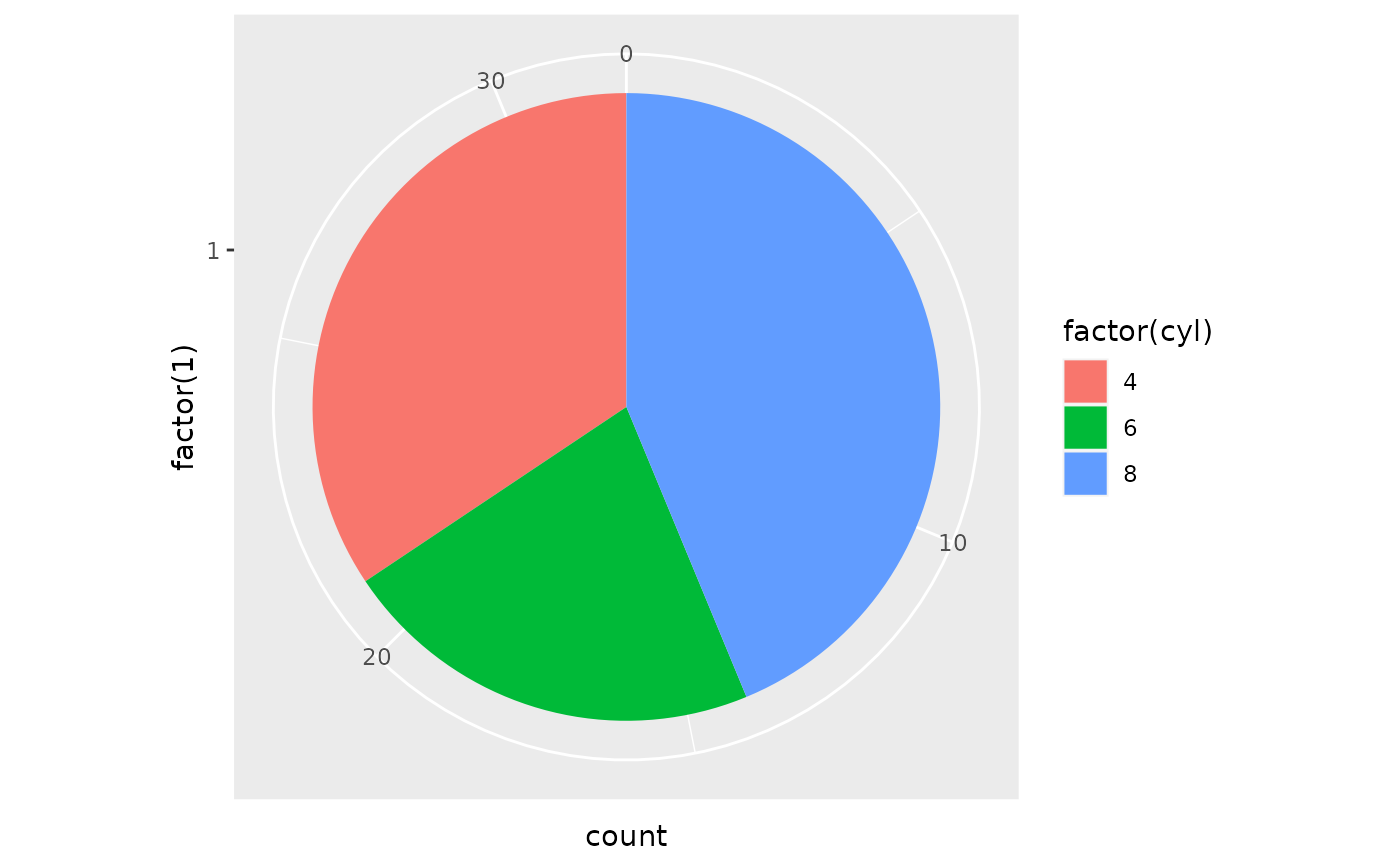
Source: ggplot2.tidyverse.org/reference/coord_polar.html
Vega-Lite does not offer a polar coordinate system, but instead offers the arc geometry. The aesthetics of the arc geometry include
- the inner radius
- the outer radius
- the start angle
- the end angle
In this way, the arc geometry makes it possible to produce radial plots like pie and donut charts.
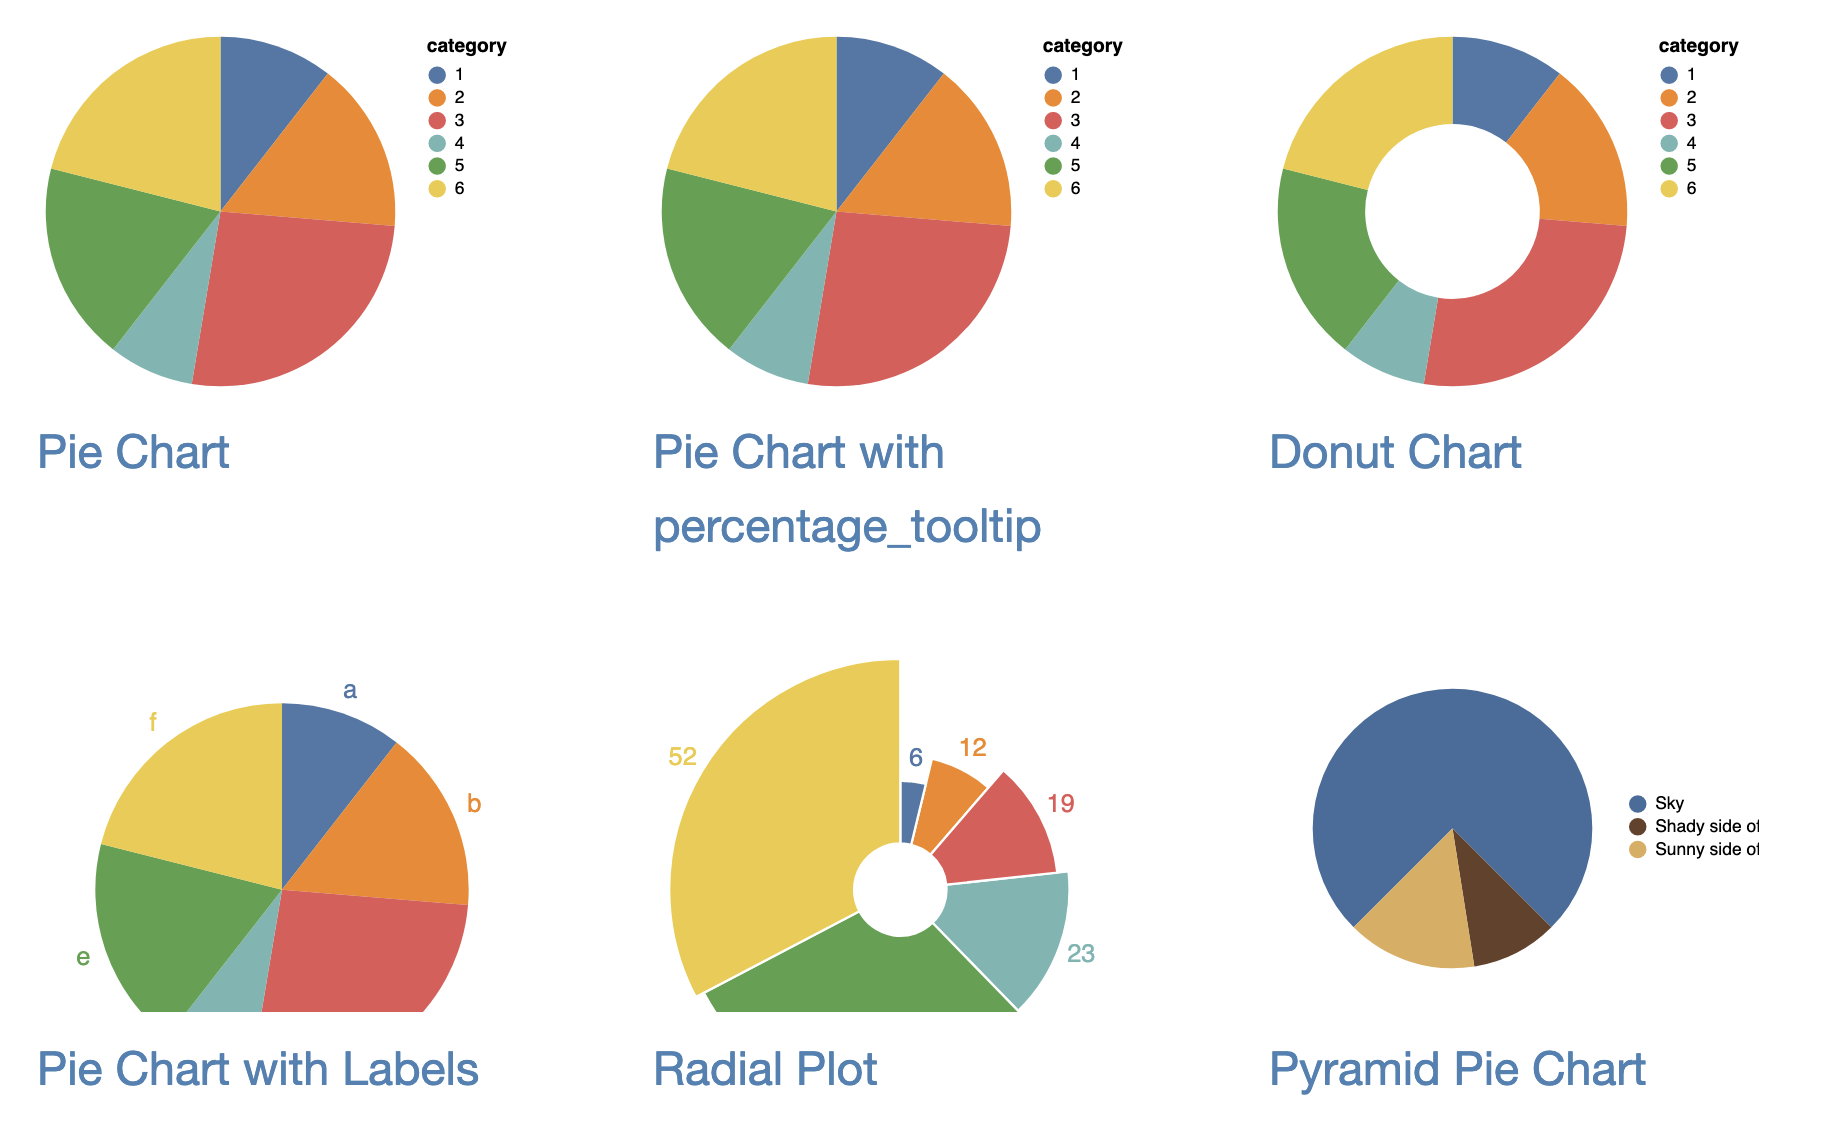
Source: vega.github.io/vega-lite/examples/#circular-plots
Observable Plot, being the youngest of the three implementations and still in active development, currently does not offer polar coordinates nor a geometry similar to Vega-Lite’s arc geometry. So it is currently not possible to make pie and donut charts with it.
Networks and hierarchies
Network visualisations and visualisations of hierarchical data are not, or only limited, supported in the 3 implementations of the Grammar.
Both hierarchical data and network data (also called graph data) consists of nodes connected to other nodes in the data through edges. When the nodes in a network have strict parent-child edges (so an edge connecting two nodes always means “is a child of” or “is a parent of”), the network is a hierarchy. Visualisation techniques for visualising hierarchies include dendrograms and tree maps.

A dendrogram showing the taxonomy of the Felidae family, or cats. Source: made with RAWgraphs, Maarten Lambrechts CC BY SA 4.0

A treemap showing the population of the biggest cities in each continent. Source: made with RAWgraphs, Maarten Lambrechts CC BY SA 4.0
Only Observable Plot has some support to make dendrograms, but for treemaps the calculations of the layout (the position and dimensions of all rectangles) needs to be done externally. After the layout calculations are done, the computed data can be fed into any of the 3 implementations and be visualised using rect geometries.
Similarly, networks can be visualised with any of the 3 tools only when the calculations for the positions of the nodes are calculated upfront, external to the implementation.
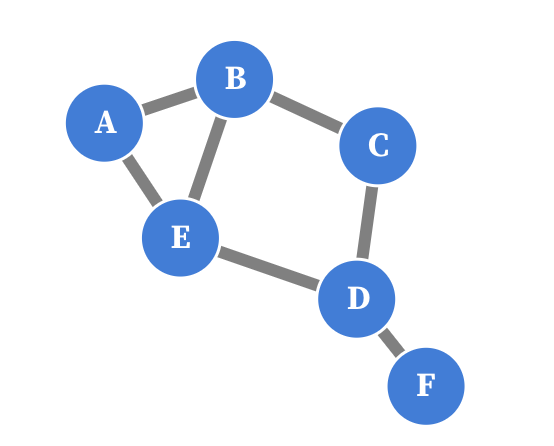
A visualisation of a simple network. Source: Maarten Lambrechts, CC BY SA 4.0
Alluvial plots and Sankey diagrams are also based on network data, and or not directly supported by the implementations of the Grammar of Graphics. Their layout needs to be calculated first before geometries can be used to show the nodes and edges of these graphs.
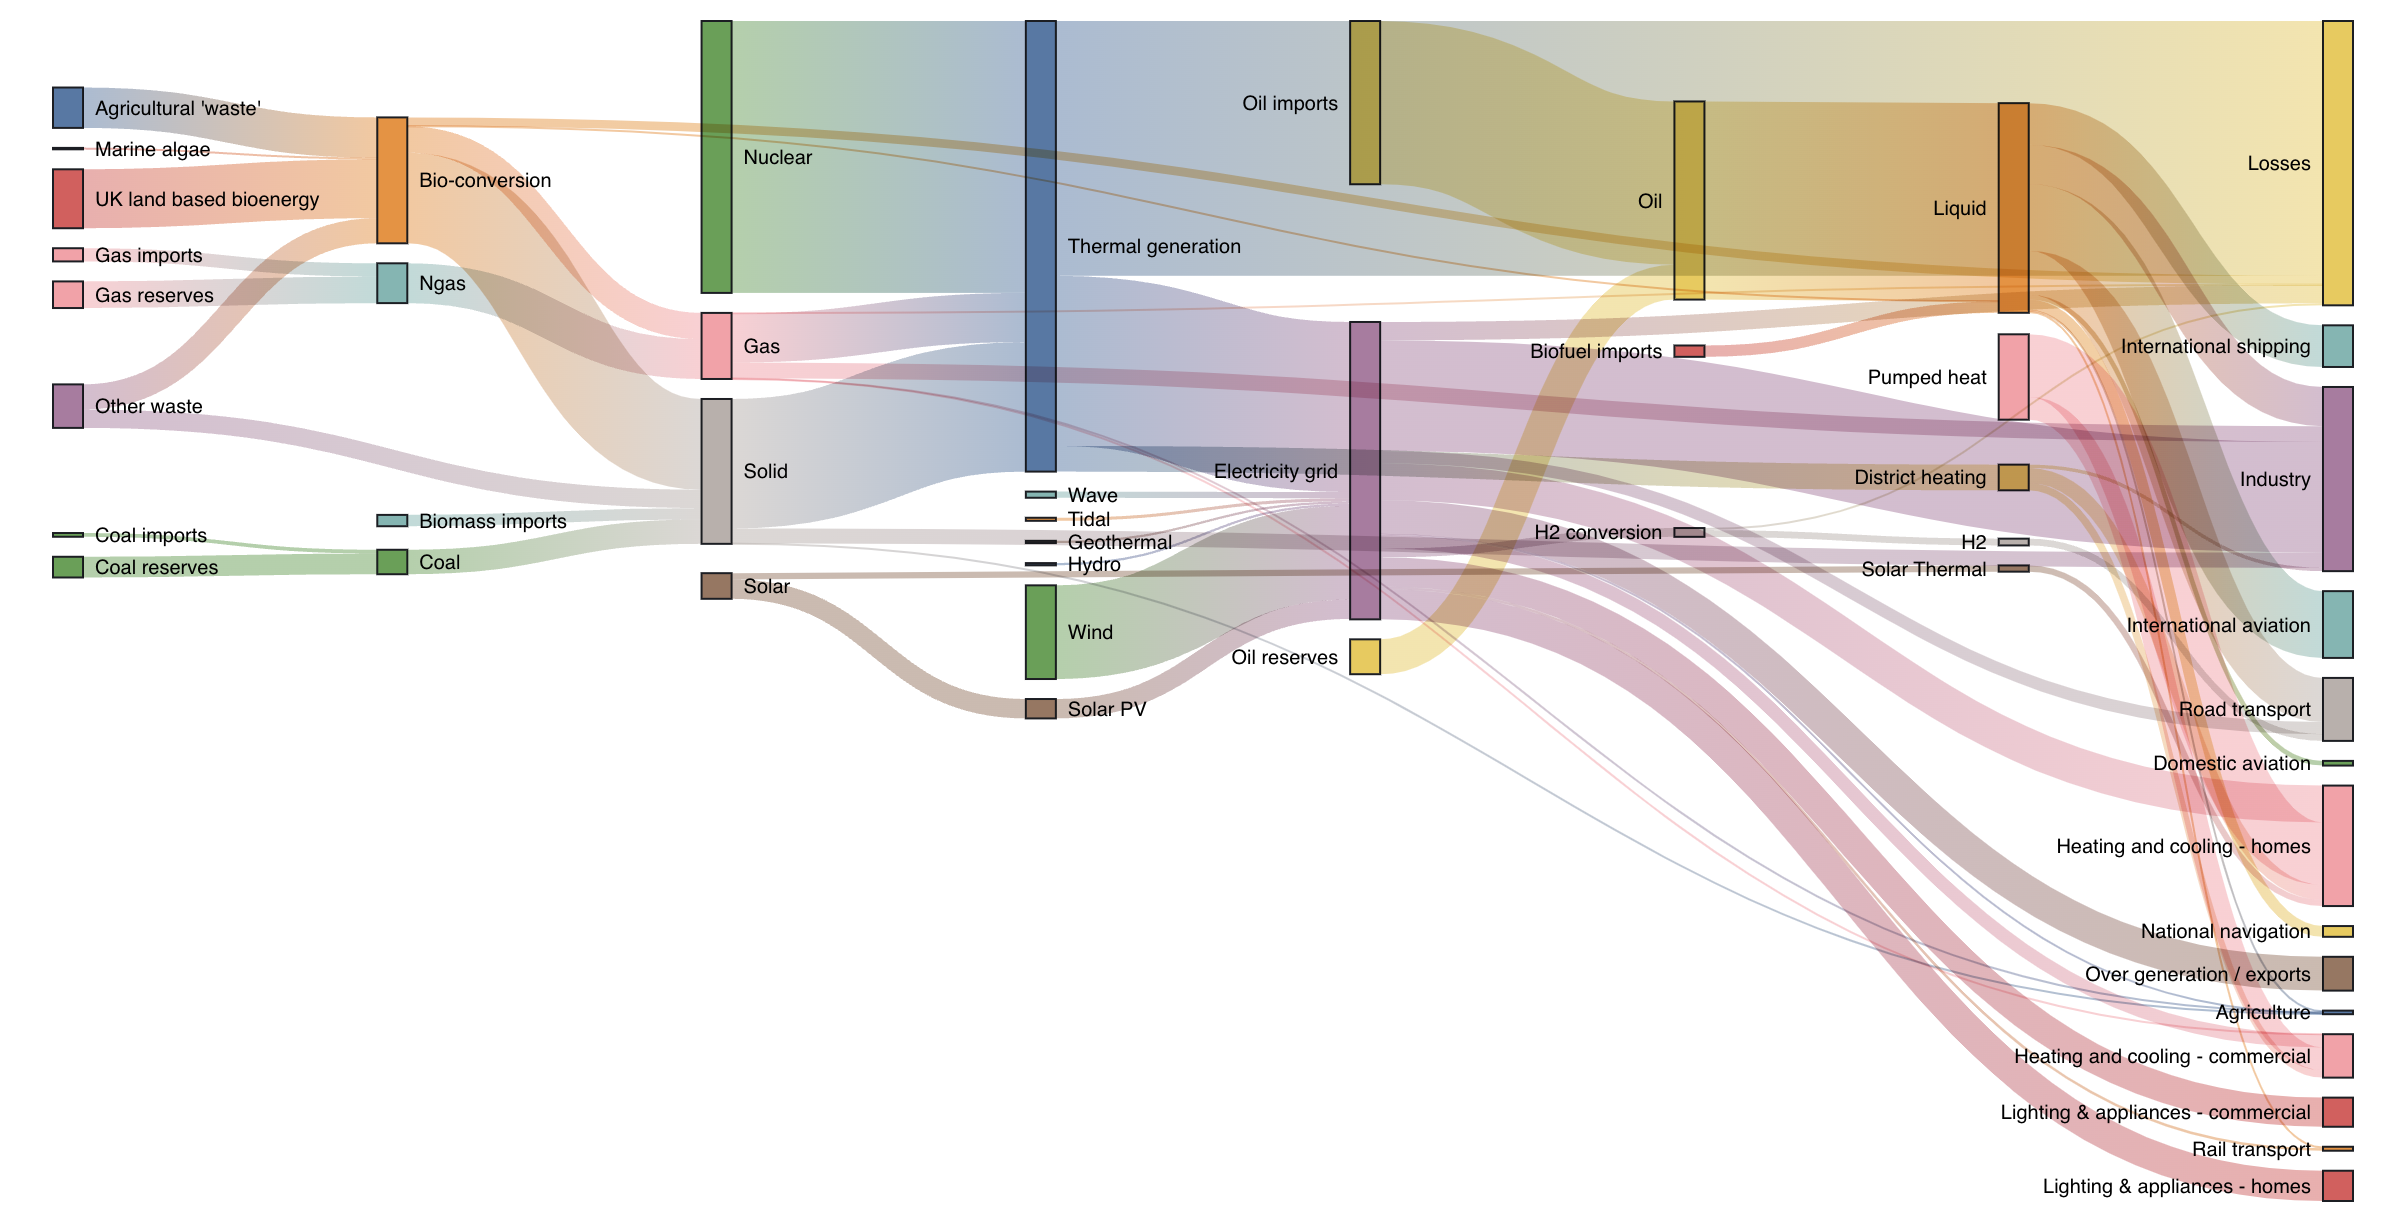
Example of a Sankey diagram showing how energy in the US is converted or transmitted before being consumed or lost. Source: Mike Bostock, observablehq.com