Some specific chart types allow you to plot a lot more dimensions in your data than the already impressive 5 dimensions you can pack into a bubble chart
Parallel coordinate plots allow you to visualise ten or even more dimensions in your data, and can plot tens or even hundreds of records at once. For each dimension in your data, an axis is created, and all axes are aligned next to each other. Then, for each record in the data, a line is drawn that connects the values for that record for each dimension.
The parallel coordinates plot below shows the values for 8 dimensions for a set of 392 types of cars from the well known cars data set. Each car is represented as a line that connects its values for all the dimensions. In this case, colour is used to double encode the last dimension (”OGN”, or the country of origin of the car).
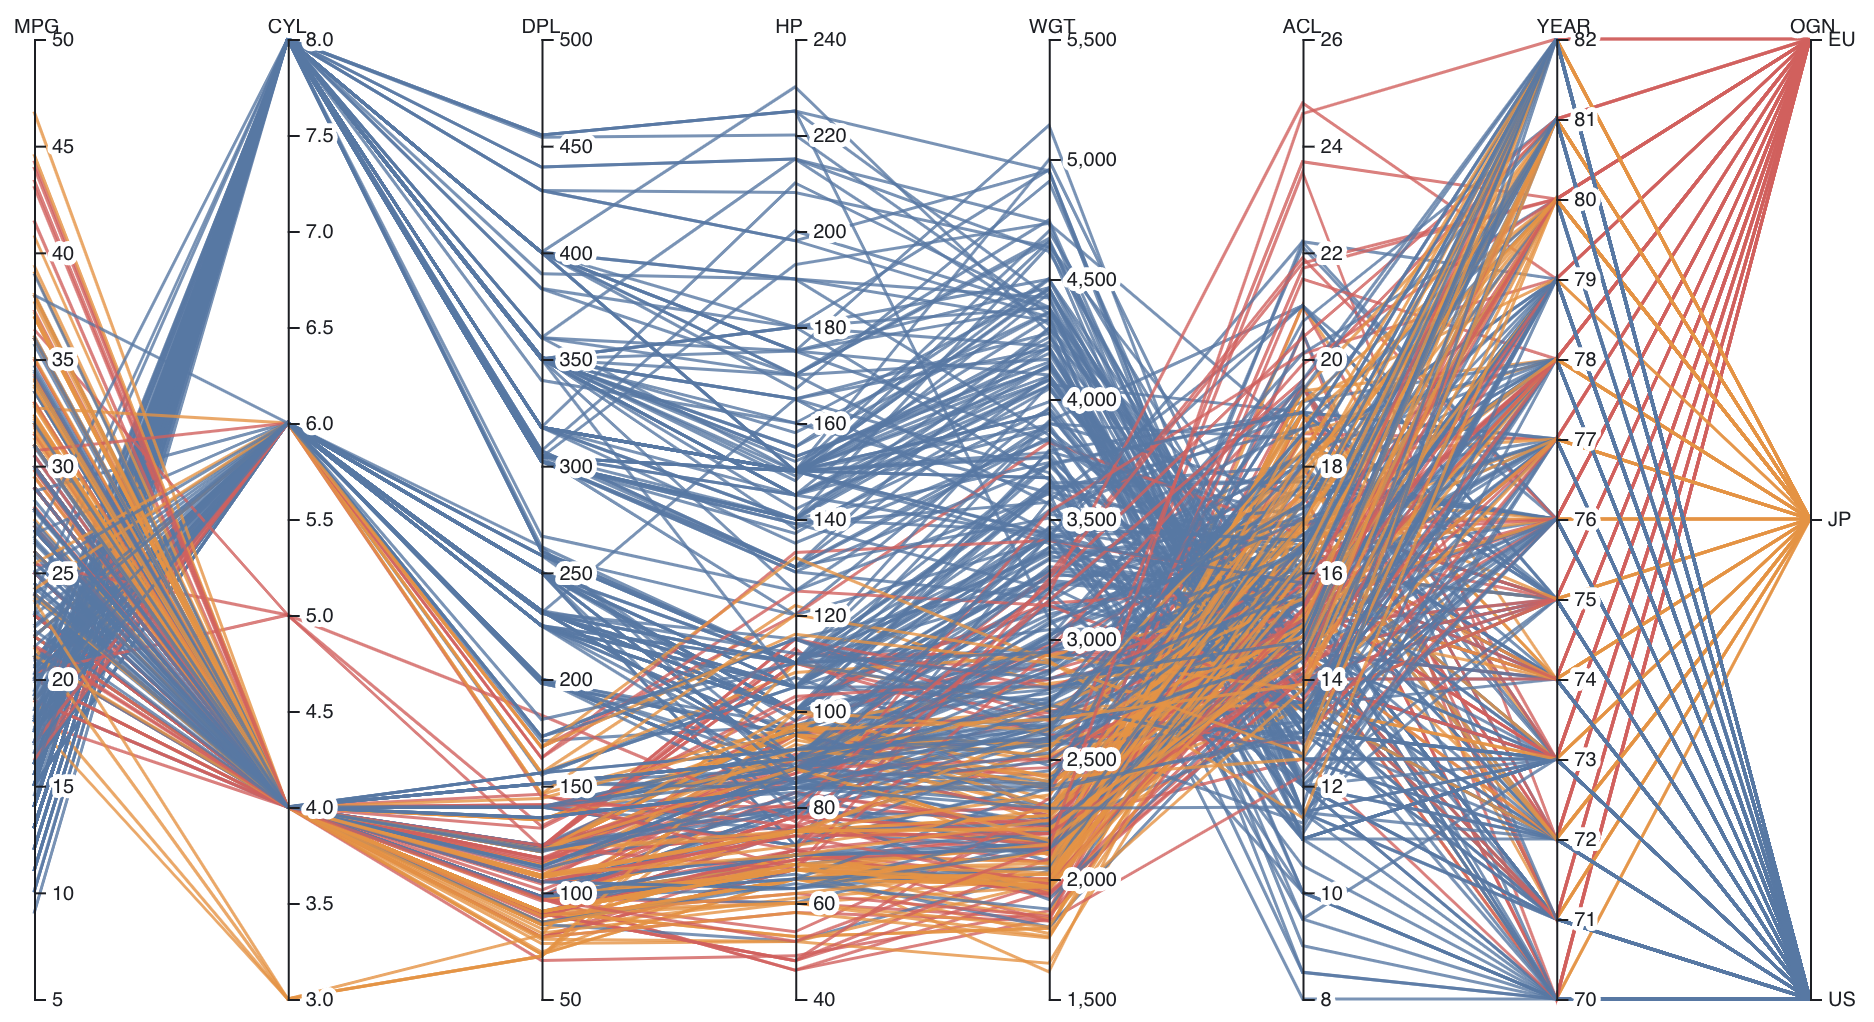
Source: Dang Quang on observablehq.com
Parallel coordinates can handle both numerical and categorical dimensions, and they are good for getting a sense of the distributions of the dimensions, for spotting outliers and also for checking correlations between dimensions. However, in order to check correlations between 2 dimensions, their axes need to be arranged next to each other in the plot. This shows that what patterns are visible on a parallel coordinates plot is determined by the ordering of the axes.
Parallel coordinate plots are only rarely used in explanatory data visualisation, and are more popular in exploratory data visualisation in order to get a better understanding of a data set.
Parallel coordinate plots are the linear version of the radar chart (also a spider chart). In a radar chart, the axes have a circular arrangement. But the circular arrangement makes reading values much harder. So when you are tempted to make a radar chart, try out a parallel coordinates plot first. It will probably work better.
A final technique to visualise multidimensional data, are glyphs. Glyphs are graphical elements, or combinations of graphical elements, of which the visual properties are mapped to multiple dimensions in the data.
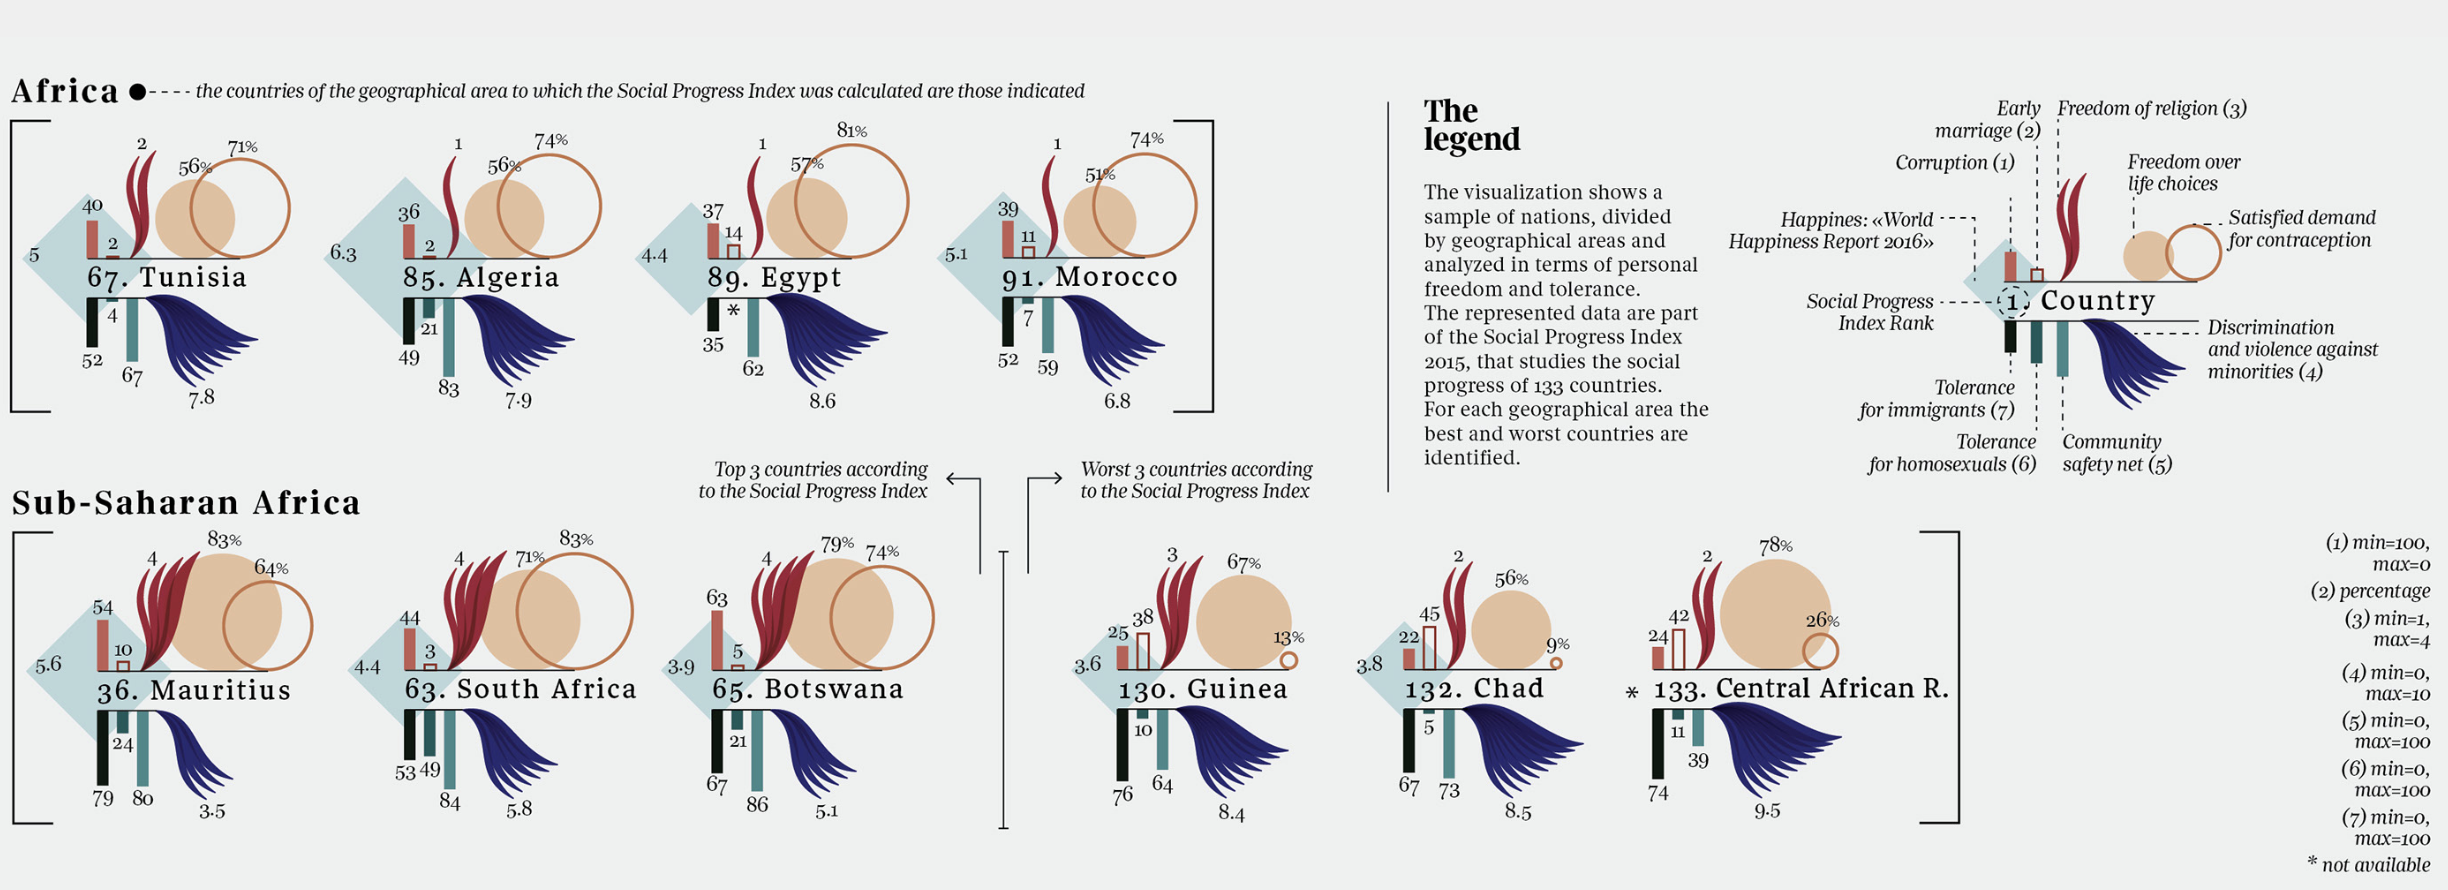
An example of glyphs to visualise multidimensional data. In this case, 11 dimensions are visualised for 10 countries. Source: Federica Fragapane for Corriere della Sera
Because glyphs are very data dense, and because some of the visual properties used to encode data can be somewhat exotic, reading glyphs requires a considerable amount of brain power, and it is very hard to get an overall picture of the dataset presented.
Visualisations that use glyphs need a legend or key to explain how to read the glyphs: without the legend, it is impossible to interpret the properties of the glyphs and read the values they encode.